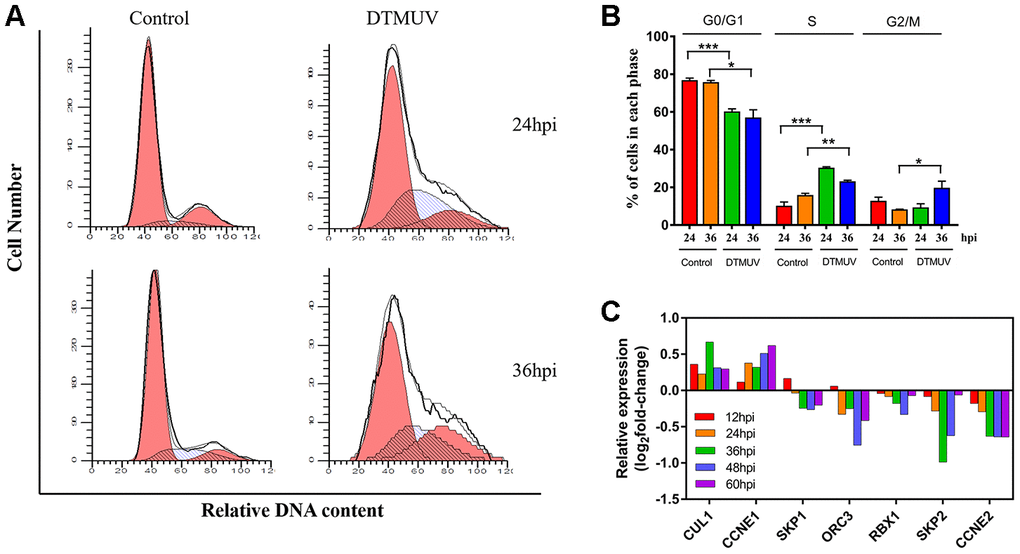
Figure 7.Analysis of cell cycle arrest induced by DTMUV infection. (A) The representative distribution and (B) the percentage of cells in G0/G1, S and G2/M phases at 24 and 36 hpi. Histograms of the cell percentage data are also shown (n=3). * p<0.05, ** p<0.01 and *** p<0.0001, compared with the control group. (C) RNA-seq data showing transcriptional expression changes of some key factors in the S checkpoint at 12, 24, 36, 48 and 60 hpi.