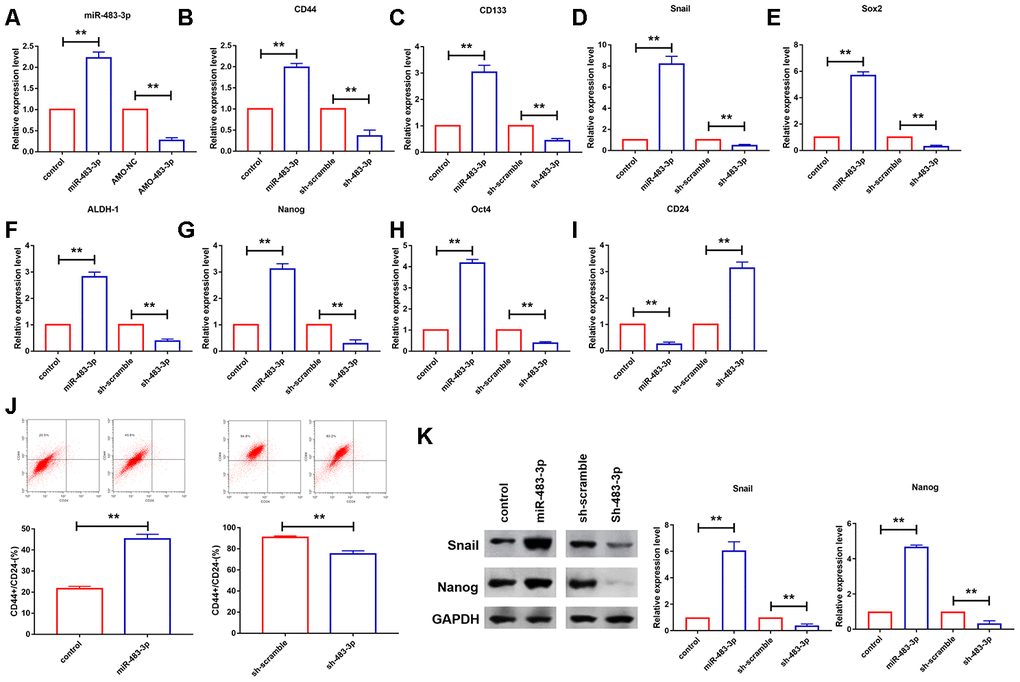
Figure 4.miR-483-3p promoted glioma cells stemness. (A) qRT-PCR analysis showed efficiency of AMO-483-3p and miR-483-3p in U251 cells. Data are mean ± SEM; Two-tailed t test was used for the statistical analysis. n=5 independent cell cultures. (B–I) qRT-PCR analysis showed the mRNA levels of CD44, CD133, Snail, Sox2, ALDH-1, Nanog, Oct4 and CD24 in U251 cells. Data are mean ± SEM; Two-tailed t test was used for the statistical analysis. n=5 independent cell cultures. (J) representative flow cytograms of the expression of CD24 and CD44. Data are mean ± SEM; Two-tailed t test was used for the statistical analysis. n=5 independent cell cultures. (K) Western bolt analysis showed reduction of protein levels of Nanog and Snail in U251 cells. Data are mean ± SEM; Two-tailed t test was used for the statistical analysis. n=5 independent cell cultures. **P<0.05.