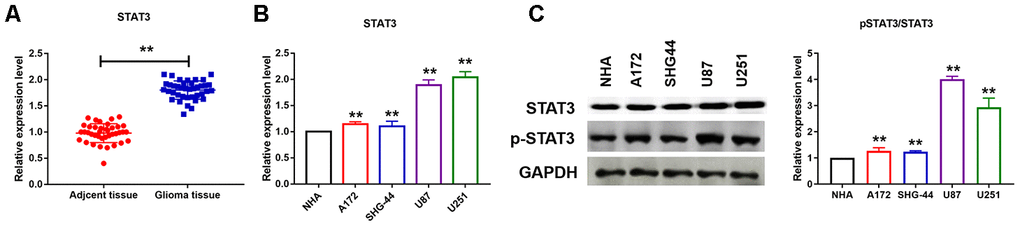
Figure 5.STAT3 was activated in U251 and U87 cells. (A, B) qRT-PCR analysis showed upregulation of STAT3 in cancer tissues and different cancer cell lines. Data are mean ± SEM; Two-tailed t test was used for the statistical analysis. n= 39 glioma patients or 5 independent cell cultures. (C) Western bolt analysis showed protein levels of STAT3 in different cancer cell lines. Data are mean ± SEM; Two-tailed t test was used for the statistical analysis. n=5 independent cell cultures. **P<0.05.