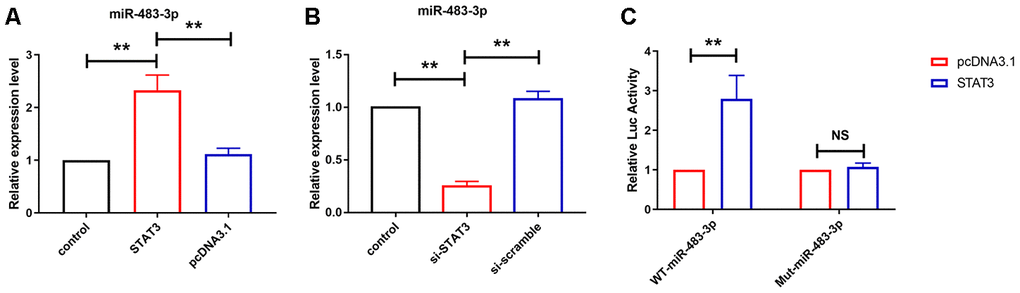
Figure 6.STAT3 transcriptional upregulated miR-483-3p level in U251 cells. (A, B) qRT-PCR analysis showed the expression level of miR-483-3p in U251 cells after overexpression and knockdown of STAT3. Data are mean ± SEM; one-way ANOVA was used for the statistical analysis. n=5 independent cell cultures. (C) Luciferase reporter activities of chimeric vectors carrying the luciferase gene and a fragment of the 3’ UTR of miR-483-3p containing the wild type or mutant STAT3 binding sites. Data are mean ± SEM; Two-tailed t test was used for the statistical analysis. n=5 independent cell cultures. **P<0.05