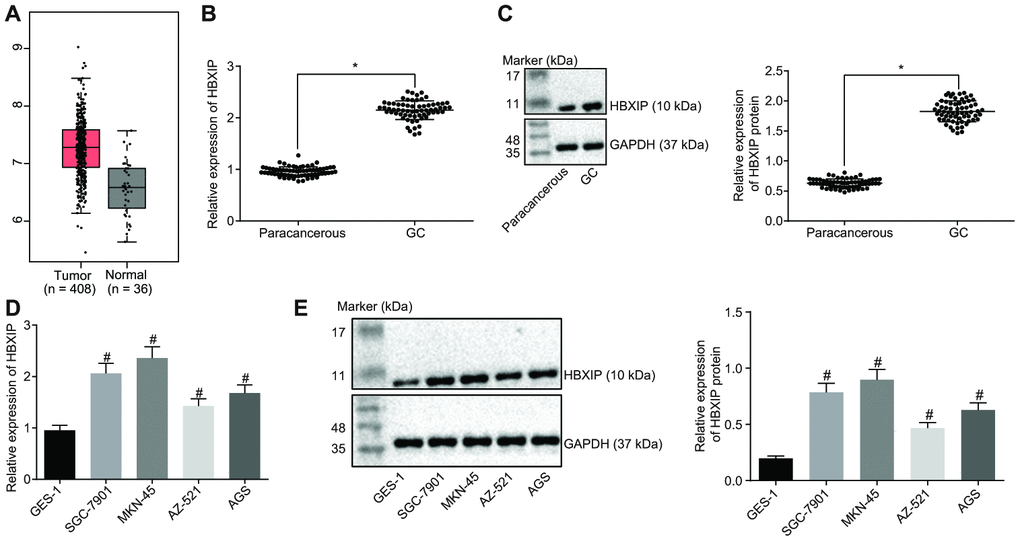
Figure 1.HBXIP expression pattern is upregulated in GC tissues and cell lines. (A) Expression pattern of HBXIP in tumor tissues and the matched normal tissues analyzed in the TCGA database. The red box on the left represents tumor samples and the gray box on the right represents normal samples. The numbers of tumor samples and normal samples are marked below. (B) HBXIP mRNA expression determined by RT-qPCR in GC and paracancerous tissues (n = 45), normalized to GAPDH, * p < 0.05 vs. the paracancerous tissues. (C) Representative Western blots of HBXIP protein and its quantitation in GC and paracancerous tissues (n = 45), normalized to GAPDH, * p < 0.05 vs. the paracancerous tissues. (D and E) HBXIP mRNA expression and protein expression patterns in GC cells and normal cells were measured by RT-qPCR (D) and Western blot analysis (E), normalized to GAPDH, # p < 0.05 vs. the GES-1 cell lines. The above data were measurement data, and expressed as mean ± standard deviation. Data in panels (B and C) were compared by paired t test and in panels (D and E) by one-way ANOVA with Tukey’s post hoc test. The cell experiment was repeated 3 times independently.