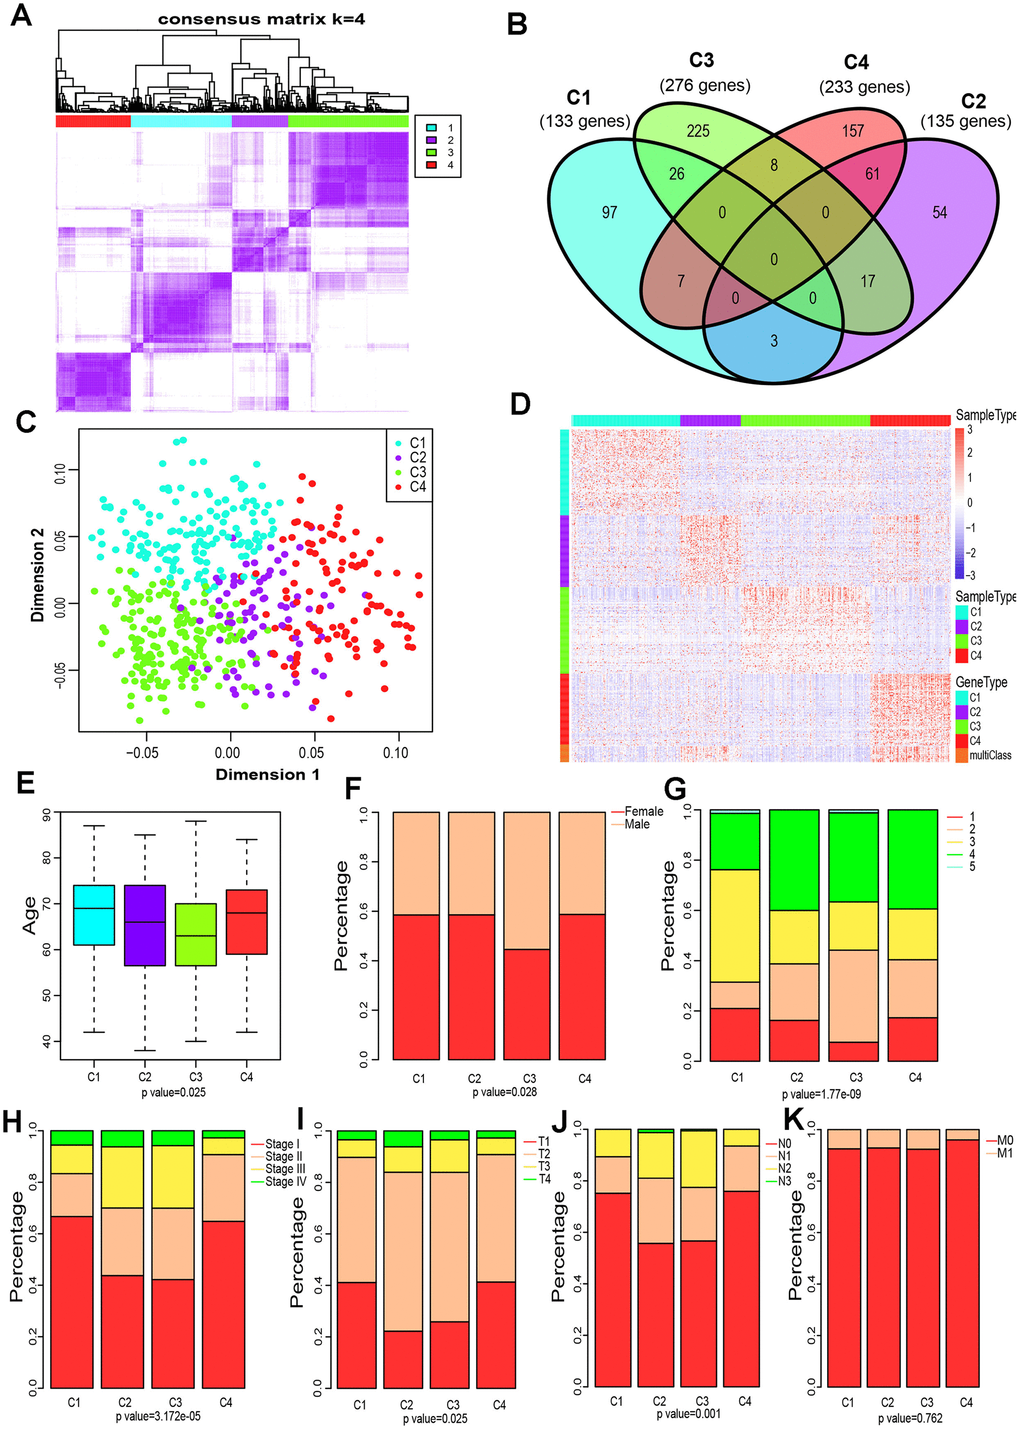
Figure 2.Four immune subtypes of LUAD in TCGA cohort and their clinical profiles. (A) Heatmap of consensus values when k=4. (B) Venn diagram showing the upregulated genes (FDR < 0.05) in each cluster. (C) The scatter plot of the top 100 upregulated genes in each cluster, distinguished by the first two principal components (PCs). (D) Gene expression profile of the top 100 upregulated genes in each cluster. Heat maps showing relative gene expression values, red indicates high expression, and blue indicates low expression. (E) Age at diagnosis of the four subtypes (Kruskal-Wallis test). The Boxplot centerlines indicating the median value; box limits show the 25th (Q1) and 75th (Q3) percentiles, lower and upper whiskers extend 1.5 times the interquartile range (IQR) from Q1 and Q3, respectively. (F) Distribution of gender among the four subtypes (chi-square test). (G) Distribution of smoking status across the four subtypes (chi-square test). (H) Distribution of stage at diagnosis in the four subtypes (chi-square test). (I) The degree of progression of the primary tumor (T) at diagnosis in the four subtypes (chi-square test). (J) The degree of the invasion of regional lymph nodes (N) at diagnosis among the four subtypes (chi-square test). (K) Incidence of metastatic (M) dissemination at diagnosis among the four subtypes (chi-square test).