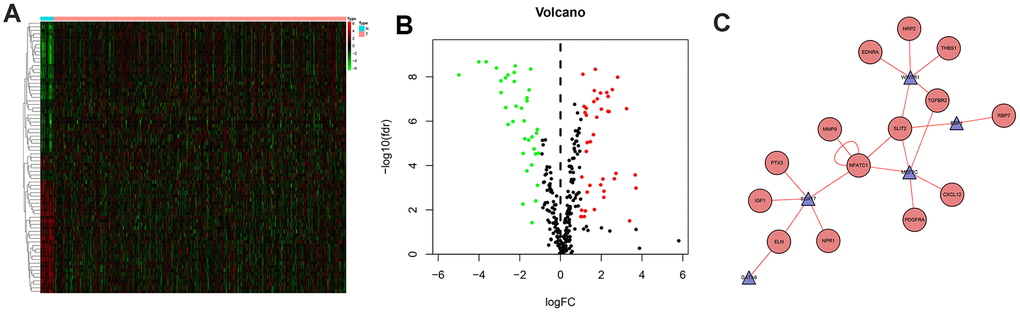
Figure 3.Differentially expressed transcription factors and regulation network. Heatmap (A) and volcano plot (B) showing different expressed transcription factors, green dots represent down-regulated and red dots represent up-regulated. And regulation network (C) presenting association of TFs and IRGs, red circles represent high risk genes and blue triangle represent TFs, while the red line represent up-regulated effects.