


Introduction
Bladder cancer is the fifth most common cancer worldwide. There are approximately 76,960 new cases and 16,390 deaths per year in the United States [1]. Muscle-invasive bladder cancer (MIBC) with tumor stages T2 to T4 accounts for most patient mortality [2]. According to the European Association of Urology guidelines, radical cystectomy remains the standard primary treatment for MIBC [3]. Even though perioperative platinum-based chemotherapy improves overall survival compared with surgery alone [4], existing treatments for MIBC are insufficient because tumor recurrence and metastasis impede clinical management and decrease the survival of many patients. Therefore, careful monitoring of bladder cancer progression using specific and sensitive biomarkers could reduce the likelihood of advanced disease.
Immunotherapy has been a major driver of personalized medicine and has demonstrated aggressive anti-tumor effects by stimulating the immune system [5, 6]. Since immune components in the tumor microenvironment play an important role in tumor cell gene expression and clinical outcomes [7–9], measurement of these immune components provides a method of predicting the long-term prognosis of cancer patients. The differential expression of immune-related genes (IRGs) is considered an effective biomarker in many types of cancer.
This study explores IRG expression’s potential clinical utility for prognostic stratification and targeted MIBC immunotherapy. We analyzed IRG expression with corresponding clinical information to develop an individualized prognostic model for MIBC patients. Bioinformatics analyses were conducted to explore the underlying regulatory mechanisms of IRGs. Our results provide a foundation for developing personalized treatment for MIBC patients.
Results
Identification of differentially expressed IRGs
The edgeR algorithm identified 4,876 differentially expressed genes, of which 3,453 were upregulated and 1,423 downregulated (Figure 1A, 1C). From this set of genes, we extracted 260 differentially expressed IRGs, including 120 upregulated and 140 downregulated (Figure 1B, 1D). The list of differentially expressed genes and IRGs is presented in Supplementary Tables 1, 2, respectively.
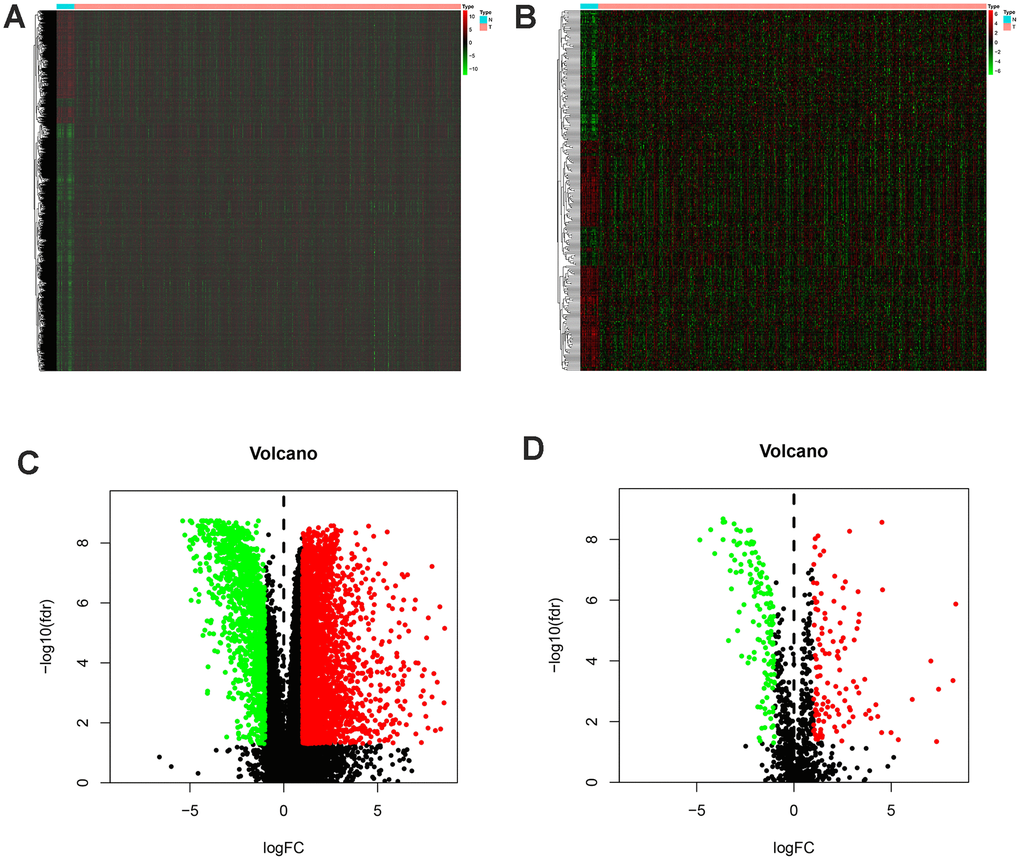
Figure 1. Differentially expressed immune-related genes of bladder cancer from the TCGA database (TCGA-BLCA). Heatmap (A) and volcano plot (C) demonstrating differentially expressed genes between bladder tumor and non-tumor tissues, green dots represent down-regulated expressed genes and red dots represent up-regulated expressed genes. Differentially expressed immune-related genes (IRGs) are shown in heatmap (B) and volcano plot (D), green dots represent down-regulated expressed genes and red dots represent up-regulated expressed genes (FDRfilter = 0.05, LogFCfilter = 1).
According to the GO enrichment analysis, inflammatory pathways were the most frequently enriched. “T cell activation,” “collagen-containing extracellular matrix,” and “receptor-ligand activity” were the most common terms among biological processes, cellular components, and molecular functions, respectively (Figure 2A). As for KEGG pathways, cytokine-cytokine receptor interactions were most often enriched by differentially expressed IRGs (Figure 2B).
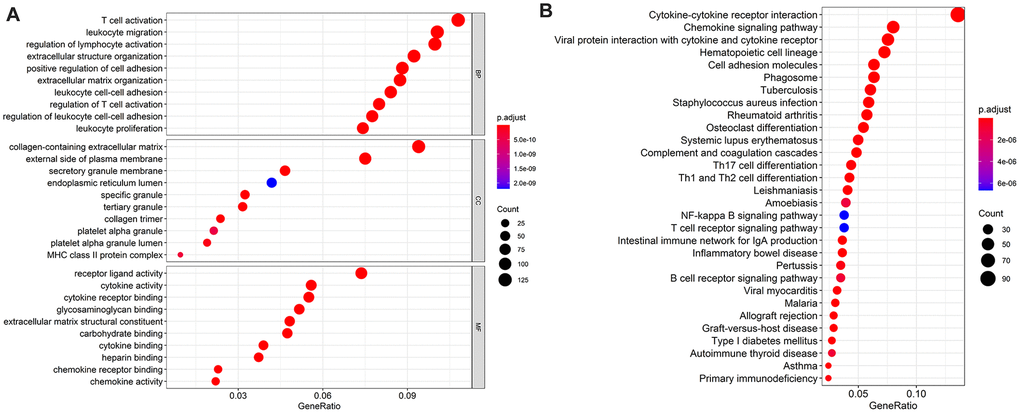
Figure 2. The top most 10 enriched Gene Ontology (GO) enrichment pathways in biological processes, cellular components, and molecular functions, respectively (A) and the top most 30 enriched Kyoto Encyclopedia of Genes and Genomes (KEGG) pathways (B). Notes: BP = biological processes; CC = cellular components; MF = molecular functions.
Identification of survival-associated IRGs
MIBC-specific IRGs related to survival outcomes (p < 0.01) were selected for the survival analysis to make the prognosis index more precise (Table 1). There were 31 IRGs that met this criterion, four of which were risk factors and the others protective factors.
Table 1. Characteristics of MIBC specific immune-related genes (univariate cox analysis, with p < 0.01).
| id | HR | HR.95L | HR.95H | pvalue |
| THBS1 | 1.004 | 1.001 | 1.007 | 0.008 |
| PI3 | 1.000 | 1.000 | 1.000 | 0.002 |
| CXCL12 | 1.013 | 1.005 | 1.021 | 0.002 |
| ZC3HAV1L | 1.141 | 1.063 | 1.223 | <0.001 |
| MMP9 | 1.000 | 1.000 | 1.000 | 0.005 |
| RBP7 | 1.014 | 1.007 | 1.020 | <0.001 |
| ADIPOQ | 1.100 | 1.052 | 1.150 | <0.001 |
| ELN | 1.016 | 1.004 | 1.028 | 0.009 |
| PDGFRA | 1.044 | 1.016 | 1.073 | 0.002 |
| AHNAK | 1.014 | 1.009 | 1.019 | <0.001 |
| PTX3 | 1.012 | 1.006 | 1.018 | <0.001 |
| IRF9 | 0.804 | 0.704 | 0.919 | 0.001 |
| OAS1 | 0.978 | 0.967 | 0.988 | <0.001 |
| RAC3 | 1.026 | 1.014 | 1.037 | <0.001 |
| NFATC1 | 1.120 | 1.034 | 1.212 | 0.005 |
| SLIT2 | 1.205 | 1.069 | 1.358 | 0.002 |
| EDNRA | 1.089 | 1.038 | 1.142 | 0.001 |
| IGF1 | 1.376 | 1.212 | 1.563 | <0.001 |
| IL34 | 1.041 | 1.014 | 1.068 | 0.002 |
| PDGFD | 1.090 | 1.046 | 1.136 | <0.001 |
| PGF | 1.034 | 1.016 | 1.052 | <0.001 |
| PPY | 1.020 | 1.010 | 1.030 | <0.001 |
| ANGPTL1 | 1.026 | 1.006 | 1.045 | 0.009 |
| GHR | 1.232 | 1.052 | 1.443 | 0.010 |
| IL17RD | 1.068 | 1.019 | 1.120 | 0.006 |
| NPR1 | 1.146 | 1.066 | 1.231 | <0.001 |
| NRP2 | 1.044 | 1.011 | 1.078 | 0.009 |
| OXTR | 1.034 | 1.008 | 1.060 | 0.010 |
| PTGER3 | 1.284 | 1.078 | 1.530 | 0.005 |
| TACR1 | 1.392 | 1.088 | 1.780 | 0.009 |
| TGFBR2 | 1.015 | 1.004 | 1.026 | 0.006 |
TF regulatory network
The regulatory relationships of the survival-associated IRGs and TFs were analyzed to explore the potential mechanisms corresponding to clinical significance (Figure 3). We examined the expression profiles of 318 TFs and found 77 that were expressed differently in MIBC than in normal tissues. Setting the correlation score cutoff value to > 0.5 resulted in 5 TFs that were screened to form the regulatory network in association with the IRGs.
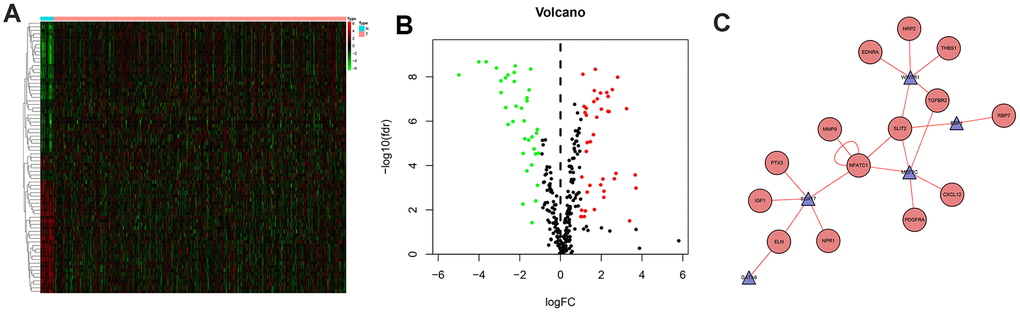
Figure 3. Differentially expressed transcription factors and regulation network. Heatmap (A) and volcano plot (B) showing different expressed transcription factors, green dots represent down-regulated and red dots represent up-regulated. And regulation network (C) presenting association of TFs and IRGs, red circles represent high risk genes and blue triangle represent TFs, while the red line represent up-regulated effects.
Evaluation of clinical outcomes
Based on the LASSO regression analysis of the expression of IRGs, the patients were divided into two risk groups (Figure 4). The formula for the prognostic index was as follows:
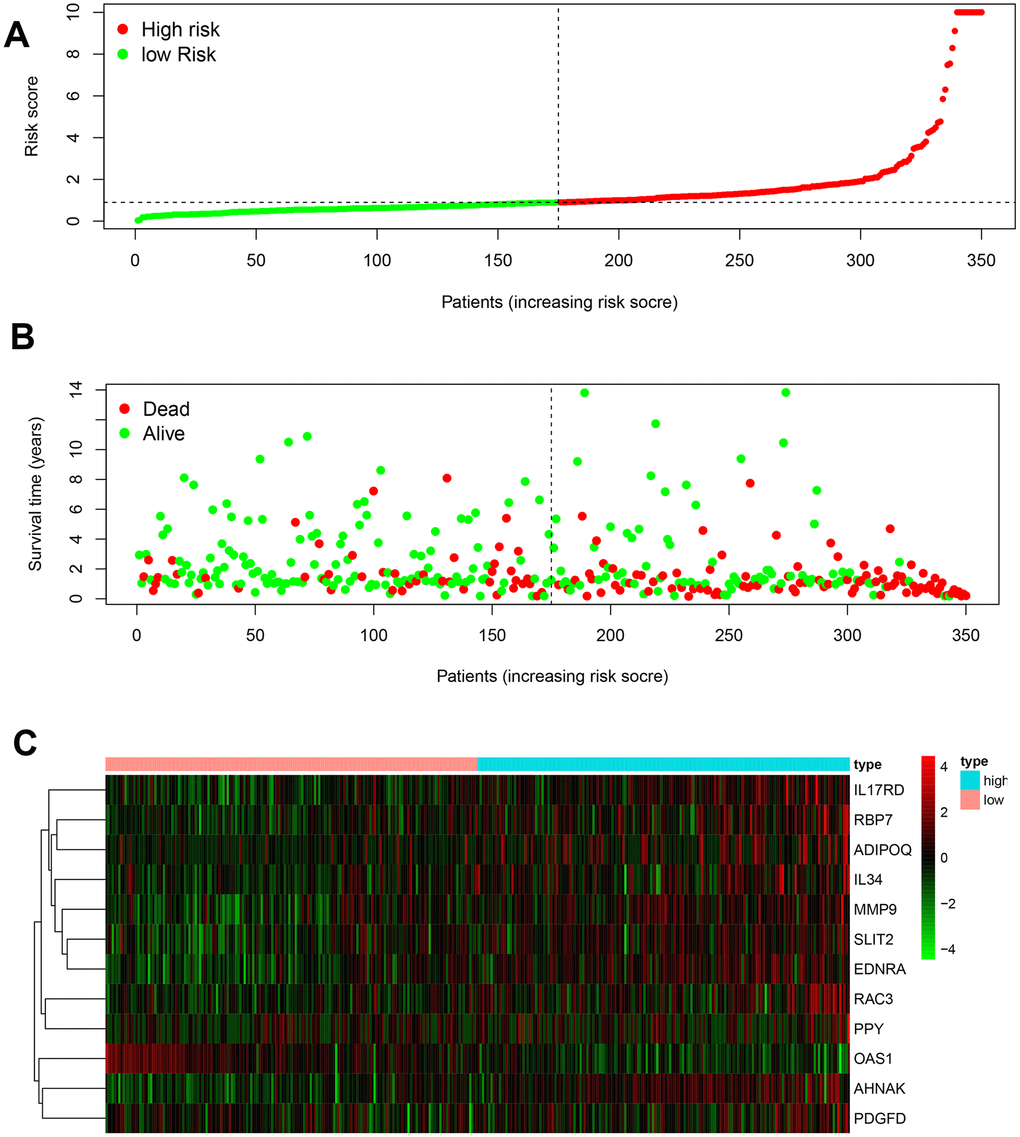
Figure 4. Development of the prognostic index based on immune-related genes. (A) Rank of prognostic index and distribution of groups. (B) Survival status of patients in different groups. (C) Heatmap of expression profiles of included genes.
(Expression level of MMP9 × 0.0004) + (Expression level of RBP7 × 0.0094) + (Expression level of ADIPOQ × 0.0800) + (Expression level of AHNAK × 0.0129) + (Expression level of OAS1 × −0.0163) + (Expression level of RAC3 × 0.0266) + (Expression level of SLIT2 × −0.1960) + (Expression level of EDNRA × 0.0829) + (Expression level of IL34 × 0.0290) + (Expression level of PDGFD × 0.0469) + (Expression level of PPY × 0.0210) + (Expression level of IL17RD × 0.0228).
With the AUC of the ROC curve equal to 0.760, the prognostic index showed moderate potential for prognosis prediction (Figure 5A). According to the results from the multivariate Cox regression, the prognostic risk score could act as an independent factor after adjusting for clinical parameters (hazard ratio 1.197, 95% confidence interval 1.103–1.299, p < 0.001] (Figure 5B). Overall survival of the low-risk group was significantly greater than the high-risk group (p < 0.001) based on the Kaplan-Meier survival curves (Figure 5C).
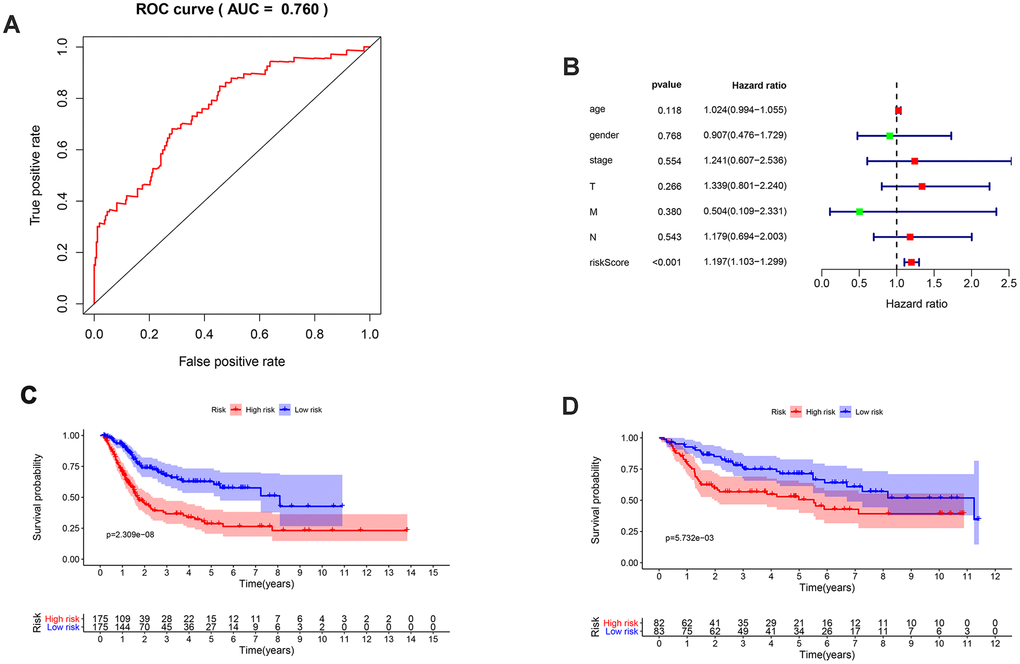
Figure 5. Validation of the prognosis signature and survival outcomes of different risk groups. (A) ROC curve of the prognosis signature with AUC equal to 0.760; (B) Multivariate Cox analysis of clinical parameters and risk score; (C) Kaplan-Meier survival curve of different risk groups of the TCGA database; (D) Kaplan-Meier survival curve of different risk groups of the GEO database in the form of cross validation.
To further explore the impact of IRGs on clinical outcomes, we conducted multivariate regression of the IRGs to elucidate the relationships between IRG expression and the clinicopathological factors in MIBC (Table 2). Results showed patients in the high risk group presented higher T stage, M stage and clinical stage.
Table 2. Relationships between the expressions of the immune-related genes and the clinicopathological factors in MIBC.
| Genes | Age (>65/ ≤65) | Gender (Male/Female) | Clinical stage (Stage III-IV/Stage II) | T stage (T3-4/T2) | N stage (N1-3/N0) | M stage (M1/M0) | ||||||
| t | P | t | P | t | P | t | P | t | P | t | P | |
| MMP9 | 0.17 | 0.865 | 0.584 | 0.561 | -1.533 | 0.128 | -1.882 | 0.062 | -0.959 | 0.371 | -0.434 | 0.665 |
| RBP7 | -0.953 | 0.342 | 1.36 | 0.183 | -2.313 | 0.022 | -2.121 | 0.036 | -1.636 | 0.153 | -1.907 | 0.062 |
| ADIPOQ | -1.022 | 0.308 | 1.047 | 0.302 | -2.504 | 0.014 | -2.498 | 0.014 | -0.915 | 0.395 | -1.469 | 0.148 |
| AHNAK | -0.326 | 0.745 | 1.084 | 0.285 | -3.822 | <0.001 | -4.049 | <0.001 | 1.288 | 0.232 | -2.263 | 0.027 |
| OAS1 | 2.255 | 0.026 | -2.568 | 0.012 | 2.339 | 0.022 | 2.349 | 0.021 | 3.367 | 0.009 | 2.103 | 0.038 |
| RAC3 | -0.43 | 0.668 | 1.2 | 0.237 | -0.514 | 0.609 | 0.078 | 0.938 | -1.619 | 0.156 | -1.998 | 0.05 |
| SLIT2 | -0.917 | 0.361 | 1.076 | 0.288 | -3.52 | <0.001 | -3.521 | <0.001 | -1.777 | 0.125 | -1.933 | 0.057 |
| EDNRA | -2.144 | 0.034 | 0.624 | 0.535 | -4.102 | <0.001 | -4.271 | <0.001 | -1.825 | 0.114 | -1.952 | 0.054 |
| IL34 | -0.124 | 0.901 | 1.506 | 0.14 | -2.671 | 0.009 | -2.722 | 0.008 | -0.927 | 0.39 | -1.99 | 0.052 |
| PDGFD | 1.259 | 0.212 | 0.519 | 0.607 | 0.184 | 0.855 | 0.198 | 0.843 | -1.035 | 0.331 | 0.371 | 0.711 |
| PPY | -1.208 | 0.229 | -1.756 | 0.081 | -1.704 | 0.091 | -1.899 | 0.06 | -0.784 | 0.46 | 1.234 | 0.219 |
| IL17RD | -0.444 | 0.659 | -1.231 | 0.221 | -4.098 | <0.001 | -3.026 | 0.003 | -0.738 | 0.485 | -0.578 | 0.564 |
| riskScore | -0.672 | 0.503 | 2.006 | 0.053 | -3.252 | 0.001 | -3.147 | 0.002 | -1.297 | 0.242 | -2.104 | 0.04 |
The immune cell infiltration analysis was performed to identify changes in the tumor microenvironment produced by the differential expression of IRGs (Figure 6). Among the six types of immune cells studied (B cells, CD4+ T cells, CD8+ T cells, macrophages, neutrophils, and dendritic cells), only macrophages showed a significant difference in infiltration abundance between the two risk groups (β = 0.18, p < 0.001).
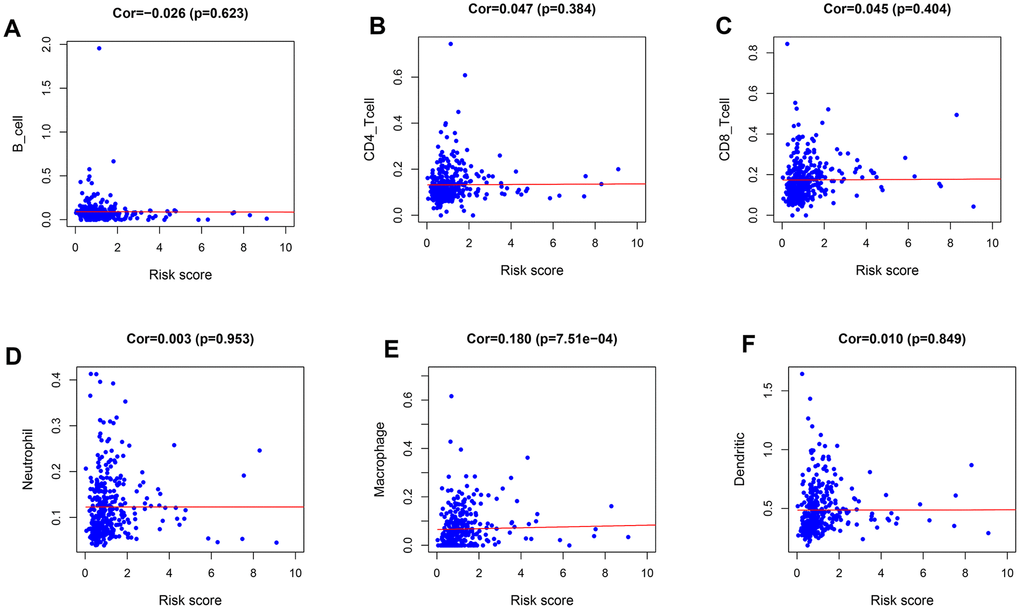
Figure 6. Relationships between the immune-related prognostic index and infiltration abundances of six types of immune cells. (A) B cells; (B) CD4 T cells; (C) CD8 T cells; (D) neutrophils; (E) macrophages; and (F) dendritic cells.
Discussion
According to our bioinformatics analysis, 31 differentially expressed IRGs significantly correlated with the clinical outcome of MIBC patients. A prognostic signature based on 12 IRGs (MMP9, RBP7, ADIPOQ, AHNAK, OAS1, RAC3, SLIT2, EDNRA, IL34, PDGFD, PPY, IL17RD) performed moderately in prognostic predictions with AUC equal to 0.76. Patients in the high-risk group experienced worse survival outcomes compared with those in the low-risk group. Furthermore, immune cell infiltration analysis showed increased tumor infiltration of macrophages in the high-risk group, suggesting that an abnormal immunoreaction may have led to the disparate prognoses of this group.
Immune regulation plays an essential role in bladder cancer through intrinsic and extrinsic control of immune cell activation [10]. Tumor cells can exacerbate immunosuppressive pathways, fostering a tolerant microenvironment. The tumor microenvironment comprises many different immune cell subpopulations endowed with anti-tumor or pro-tumor activity [11]. Furthermore, different levels of tumor-infiltrating immune cells in the tumor microenvironment affect the prognosis of patients [12]. As for MIBC, molecular biomarkers and histopathology are predictive tools to assess possible clinical outcomes and guide further therapies [13, 14]. Based on these findings, IRG signatures could be used to identify potentially high-risk patients and thus allow for individualized treatment strategies.
Many of the 12 IRGs in our prognostic signature have previously been associated with cancer survival outcomes. Researchers have demonstrated that MMP9 is significantly associated with poor survival of cancer patients by way of promoting the invasiveness of cancer cells [15], and high expression of MMP9 has been observed in bladder cancer patients with poor prognosis and rapid tumor progression [16]. According to Elmasry et al., overexpression of RBP7 was an independent biomarker of poor cancer-specific survival in colon cancer [17], although no studies of RBP7 in MIBC have been reported. ADIPOQ is relevant in obesity and may potentially lead to metabolic syndrome [18], thus possibly worsening the prognosis of MIBC patients. As for AHNAK, two studies have conducted prognosis model analyses with this and other bladder cancer genes [19, 20], and both showed poor outcomes with high levels of AHNAK expression. One study has reported that the methylation status of SLIT2 is associated with low stage and histological grade for the initial diagnosis of non-MIBC [21]. Still, the gene expression level was unmentioned in the study. EDNRA overexpression was shown to be associated with metastasis and poor outcome in advanced bladder cancer patients [22]. Further research is needed to elucidate the impact of these IRGs on MIBC outcomes more fully.
Although several previous studies are focusing on distinct survival outcomes for differentially expressed genes [23–25], no genome-wide profiling studies of MIBC have been conducted. Until recently, the treatment of bladder cancer has made slow progress. Platinum-based chemotherapy is still widely used for metastatic bladder cancer without significant survival improvement [26]. However, in recent years, cancer immunotherapy has played an important role in clinical cancer management [27]. With the discovery of immune checkpoint inhibitors, MIBC patients may receive better prognoses. Programmed cell death 1 (PD-1, also known as PDCD1) on the surface of CD8+ T cells binds to programmed cell death ligand 1 (PD-L1, also known as CD274) produced by tumor tissue, leading to a limited host immune response. By increasing the level of infiltrated CD8+ T cells, PD-L1 inhibitors demonstrate an effective anti-tumor immune response [28]. T cells play an important role in the “immune surveillance” theories of cancer, with complex effects, including expression of polymorphic antigen receptors for specific antigen recognition, possession of effector functions, and development of memory characteristics [29, 30]. However, studies have only observed a significant increase in the level of CD4+ cells (specifically Th17 cells) in the blood of bladder cancer patients [31]; thus, the role of tumor-infiltrated CD4+ cells has not been elucidated. Our results showed no distinct expression differences of CD4+ cells in the two risk groups, indicating that the level of CD4+ cells probably does not independently reflect the risk classification for MIBC. Previous research demonstrated that macrophages are divided into different subtypes, with anti-tumor (M1) and pro-tumor activities (M2), but the holistic phenotype depended on the cytokine microenvironment in the tumor tissues [32]. For MIBC, high levels of tumor-infiltrated macrophages indicate a dismal prognosis and adjuvant chemotherapy resistance [33]. Our current analyses showed an upregulated level of macrophages in the high-risk group of MIBC patients. Moreover, Zhou et al. reported tumor-infiltrating neutrophils’ involvement in tumorigenesis and a negative correlation between neutrophils and CD8+ T cells [34], which indicates a state of immunosuppression in MIBC caused by a high level of tumor-infiltrating neutrophils.
Although a limitation of our study is that the effects of specific genes in tumor growth, invasion, and metastasis could not be evaluated, our analysis provided important information on MIBC survival outcomes.
Conclusions
Our prognostic signature effectively divides MIBC patients into different risk groups; thus, individuals with worse predicted survival outcomes can be identified before the advancement of their disease and treated intensively with appropriate therapies. The differential gene expression identified in our study provides insight into the MIBC tumor microenvironment, contributing to the development of IRG-targeted therapies to improve the survival of MIBC patients.
Materials and Methods
Clinical samples and data acquisition
We obtained transcriptome RNA-sequencing (RNA-seq) data of bladder cancer samples from the Cancer Genome Atlas (TCGA) database (https://portal.gdc.cancer.gov/projects/TCGA-BLCA), which included data from 414 primary cancers and 19 non-tumor tissues. Raw count data and relevant clinical information for the patients were also downloaded and extracted. A list of IRGs was obtained from the Immunology Database and Analysis Portal (ImmPort) database [35]. A list of 318 transcription factors (TFs) was downloaded from the Cistrome Cancer database [36] to explore the potential mechanisms of IRG expression. Patients with MIBC (tumor stage ≥T2) were identified with this clinical data and included in the study. Patients with a follow-up duration of less than 60 days were excluded. The analysis included 375 MIBC patients. To verify the robustness of the results, we used the Gene Expression Omnibus database to perform a cross-validation, among which 165 samples were selected. The flowchart outlining the sample selection is provided in Supplementary Figure 1.
Differential gene analysis
We used the limma (linear models for microarray data) software package for the statistical R programming language to identify the differentially expressed genes between the tumor tissues and normal tissues [37], and the differential expressions were analyzed using the Wilcoxon test [38]. We set a false discovery rate <0.05 and a log2(fold change) >1 as the cutoff values. We then performed the Spearman correlation test to identify the association of IRGs and TFs, using a correlation filter of 0.5. Also, Gene Ontology (GO) enrichment was performed to investigate the functions of the gene products [39] and the Kyoto Encyclopedia of Genes and Genomes (KEGG) [40] pathway enrichment was conducted to explore the potential molecular mechanisms of the differentially expressed IRGs.
Survival analysis and tumor-infiltrating immune cell analysis
Survival-associated IRGs for MIBC were identified using univariate and multivariate Cox regression analyses with a threshold value of p < 0.05. With the use of least absolute shrinkage and selection operator (LASSO) regression analysis, we selected specific IRGs. We calculated the individualized risk score with coefficients to construct a prognostic signature separating the high-risk and low-risk groups. Subsequently, Kaplan-Meier survival curves were generated based on the different risk groups to explore the survival differences. A receiver operating characteristic (ROC) analysis was performed to validate the predictive value of our model, and the area under the curve (AUC) was calculated. The Cox regression analyses were conducted for both clinical characteristics and risk scores to investigate whether risk score could independently predict survival prognosis. The tumor-infiltrating immune cell analysis (including B cells, CD4+ T cells, CD8+ T cells, macrophages, neutrophils, and dendritic cells) was performed using the TIMER database [41]. In the above analyses, p < 0.05 was considered statistically significant.
Author Contributions
All authors contributed to the planning and design of the study. K.J. and S.Q. were involved in review of the raw data and directly involved in the analysis. J.K.L. and X.N.Z. provided analytical feedback based on aggregated results. D.J. and X.H.Z. drafted the manuscript, with input from all authors. X.Y.L. was responsible for the chart making. All authors provided substantive review and commentary on multiple drafts and approved the final version. K.J. and S.Q. had full access to all of the data in the study and takes responsibility for the integrity of the data and the accuracy of the data analysis.
Acknowledgments
The authors would like to thank staff at Center of Biomedical Big Data, West China Hospital, Sichuan University for logistical support of this analysis.
Conflicts of Interest
The authors have declared that no conflicts of interest exist.
Funding
The authors acknowledge Ian Charles Tobias for reviewing the manuscript. This work was supported by the National key research and development program of China (Grant No. SQ2017YFC0908003), National Natural Science Foundation of China (Grant No.81702536, 81770756), the Sichuan Science and Technology Program (2017HH0063), China Postdoctoral Science Foundation (2017M612971), Post-Doctor Research Project, West China Hospital, Sichuan University (2018HXBH085), National Clinical Research Center for Geriatrics, West China Hospital, Sichuan University (Z2018C01).
References
- 1. American Cancer Society. Key Statistics for Bladder Cancer. http://www.cancer.org/cancer/bladdercancer/detailedguide/bladder-cancer-key-statistics.
- 2. Prasad SM, Decastro GJ, Steinberg GD, and Medscape. Urothelial carcinoma of the bladder: definition, treatment and future efforts. Nat Rev Urol. 2011; 8:631–42. https://doi.org/10.1038/nrurol.2011.144 [PubMed]
- 3. Witjes JA, Compérat E, Cowan NC, De Santis M, Gakis G, Lebret T, Ribal MJ, Van der Heijden AG, Sherif A, and European Association of Urology. EAU guidelines on muscle-invasive and metastatic bladder cancer: summary of the 2013 guidelines. Eur Urol. 2014; 65:778–92. https://doi.org/10.1016/j.eururo.2013.11.046 [PubMed]
- 4. Grossman HB, Natale RB, Tangen CM, Speights VO, Vogelzang NJ, Trump DL, deVere White RW, Sarosdy MF, Wood DP
Jr , Raghavan D, Crawford ED. Neoadjuvant chemotherapy plus cystectomy compared with cystectomy alone for locally advanced bladder cancer. N Engl J Med. 2003; 349:859–66. https://doi.org/10.1056/NEJMoa022148 [PubMed] - 5. Kobold S, Pantelyushin S, Rataj F, Vom Berg J. Rationale for combining bispecific T cell activating antibodies with checkpoint blockade for cancer therapy. Front Oncol. 2018; 8:285. https://doi.org/10.3389/fonc.2018.00285 [PubMed]
- 6. Popovic A, Jaffee EM, Zaidi N. Emerging strategies for combination checkpoint modulators in cancer immunotherapy. J Clin Invest. 2018; 128:3209–18. https://doi.org/10.1172/JCI120775 [PubMed]
- 7. Şenbabaoğlu Y, Gejman RS, Winer AG, Liu M, Van Allen EM, de Velasco G, Miao D, Ostrovnaya I, Drill E, Luna A, Weinhold N, Lee W, Manley BJ, et al. Tumor immune microenvironment characterization in clear cell renal cell carcinoma identifies prognostic and immunotherapeutically relevant messenger RNA signatures. Genome Biol. 2016; 17:231. https://doi.org/10.1186/s13059-016-1092-z [PubMed]
- 8. Yoshihara K, Shahmoradgoli M, Martínez E, Vegesna R, Kim H, Torres-Garcia W, Treviño V, Shen H, Laird PW, Levine DA, Carter SL, Getz G, Stemke-Hale K, et al. Inferring tumour purity and stromal and immune cell admixture from expression data. Nat Commun. 2013; 4:2612. https://doi.org/10.1038/ncomms3612 [PubMed]
- 9. Cooper LA, Gutman DA, Chisolm C, Appin C, Kong J, Rong Y, Kurc T, Van Meir EG, Saltz JH, Moreno CS, Brat DJ. The tumor microenvironment strongly impacts master transcriptional regulators and gene expression class of glioblastoma. Am J Pathol. 2012; 180:2108–19. https://doi.org/10.1016/j.ajpath.2012.01.040 [PubMed]
- 10. Schneider AK, Chevalier MF, Derré L. The multifaceted immune regulation of bladder cancer. Nat Rev Urol. 2019; 16:613–30. https://doi.org/10.1038/s41585-019-0226-y [PubMed]
- 11. Hanahan D, Weinberg RA. Hallmarks of cancer: the next generation. Cell. 2011; 144:646–74. https://doi.org/10.1016/j.cell.2011.02.013 [PubMed]
- 12. Fridman WH, Zitvogel L, Sautès-Fridman C, Kroemer G. The immune contexture in cancer prognosis and treatment. Nat Rev Clin Oncol. 2017; 14:717–34. https://doi.org/10.1038/nrclinonc.2017.101 [PubMed]
- 13. Miyamoto DT, Mouw KW, Feng FY, Shipley WU, Efstathiou JA. Molecular biomarkers in bladder preservation therapy for muscle-invasive bladder cancer. Lancet Oncol. 2018; 19:e683–95. https://doi.org/10.1016/S1470-2045(18)30693-4 [PubMed]
- 14. Alifrangis C, McGovern U, Freeman A, Powles T, Linch M. Molecular and histopathology directed therapy for advanced bladder cancer. Nat Rev Urol. 2019; 16:465–83. https://doi.org/10.1038/s41585-019-0208-0 [PubMed]
- 15. Hu X, Li D, Zhang W, Zhou J, Tang B, Li L. Matrix metalloproteinase-9 expression correlates with prognosis and involved in ovarian cancer cell invasion. Arch Gynecol Obstet. 2012; 286:1537–43. https://doi.org/10.1007/s00404-012-2456-6 [PubMed]
- 16. Qin Z, Wang Y, Tang J, Zhang L, Li R, Xue J, Han P, Wang W, Qin C, Xing Q, Yang J, Zhang W. High LINC01605 expression predicts poor prognosis and promotes tumor progression via up-regulation of MMP9 in bladder cancer. Biosci Rep. 2018; 38:BSR20180562. https://doi.org/10.1042/BSR20180562 [PubMed]
- 17. Elmasry M, Brandl L, Engel J, Jung A, Kirchner T, Horst D. RBP7 is a clinically prognostic biomarker and linked to tumor invasion and EMT in colon cancer. J Cancer. 2019; 10:4883–91. https://doi.org/10.7150/jca.35180 [PubMed]
- 18. Ohashi K, Ouchi N, Kihara S, Funahashi T, Nakamura T, Sumitsuji S, Kawamoto T, Matsumoto S, Nagaretani H, Kumada M, Okamoto Y, Nishizawa H, Kishida K, et al. Adiponectin I164T mutation is associated with the metabolic syndrome and coronary artery disease. J Am Coll Cardiol. 2004; 43:1195–200. https://doi.org/10.1016/j.jacc.2003.10.049 [PubMed]
- 19. Chu J, Li N, Li F. A risk score staging system based on the expression of seven genes predicts the outcome of bladder cancer. Oncol Lett. 2018; 16:2091–96. https://doi.org/10.3892/ol.2018.8904 [PubMed]
- 20. Wu Q, Fu C, Li M, Li J, Li Z, Qi L, Ci X, Ma G, Gao A, Fu X, A J, An N, Liu M, et al. CINP is a novel cofactor of KLF5 required for its role in the promotion of cell proliferation, survival and tumor growth. Int J Cancer. 2019; 144:582–94. https://doi.org/10.1002/ijc.31908 [PubMed]
- 21. Roperch JP, Grandchamp B, Desgrandchamps F, Mongiat-Artus P, Ravery V, Ouzaid I, Roupret M, Phe V, Ciofu C, Tubach F, Cussenot O, Incitti R. Promoter hypermethylation of HS3ST2, SEPTIN9 and SLIT2 combined with FGFR3 mutations as a sensitive/specific urinary assay for diagnosis and surveillance in patients with low or high-risk non-muscle-invasive bladder cancer. BMC Cancer. 2016; 16:704. https://doi.org/10.1186/s12885-016-2748-5 [PubMed]
- 22. Laurberg JR, Jensen JB, Schepeler T, Borre M, Ørntoft TF, Dyrskjøt L. High expression of GEM and EDNRA is associated with metastasis and poor outcome in patients with advanced bladder cancer. BMC Cancer. 2014; 14:638. https://doi.org/10.1186/1471-2407-14-638 [PubMed]
- 23. Chen S, Zhang N, Shao J, Wang T, Wang X. A novel gene signature combination improves the prediction of overall survival in urinary bladder cancer. J Cancer. 2019; 10:5744–53. https://doi.org/10.7150/jca.30307 [PubMed]
- 24. Aldoghachi AF, Baharudin A, Ahmad U, Chan SC, Ong TA, Yunus R, Razack AH, Yusoff K, Veerakumarasivam A. Evaluation of CERS2 gene as a potential biomarker for bladder cancer. Dis Markers. 2019; 2019:3875147. https://doi.org/10.1155/2019/3875147 [PubMed]
- 25. Yang D, Ma Y, Zhao P, Ma J, He C. Systematic screening of protein-coding gene expression identified HMMR as a potential independent indicator of unfavorable survival in patients with papillary muscle-invasive bladder cancer. Biomed Pharmacother. 2019; 120:109433. https://doi.org/10.1016/j.biopha.2019.109433 [PubMed]
- 26. Milowsky MI, Rumble RB, Booth CM, Gilligan T, Eapen LJ, Hauke RJ, Boumansour P, Lee CT. Guideline on Muscle-Invasive and Metastatic Bladder Cancer (European Association of Urology Guideline): American Society of Clinical Oncology Clinical Practice Guideline Endorsement. J Clin Oncol. 2016; 34:1945–52. https://doi.org/10.1200/JCO.2015.65.9797 [PubMed]
- 27. Chen DS, Mellman I. Oncology meets immunology: the cancer-immunity cycle. Immunity. 2013; 39:1–10. https://doi.org/10.1016/j.immuni.2013.07.012 [PubMed]
- 28. Tumeh PC, Harview CL, Yearley JH, Shintaku IP, Taylor EJ, Robert L, Chmielowski B, Spasic M, Henry G, Ciobanu V, West AN, Carmona M, Kivork C, et al. PD-1 blockade induces responses by inhibiting adaptive immune resistance. Nature. 2014; 515:568–71. https://doi.org/10.1038/nature13954 [PubMed]
- 29. Burnet FM. Immunological surveillance in neoplasia. Transplant Rev. 1971; 7:3–25. https://doi.org/10.1111/j.1600-065x.1971.tb00461.x [PubMed]
- 30. Schreiber RD, Old LJ, Smyth MJ. Cancer immunoediting: integrating immunity’s roles in cancer suppression and promotion. Science. 2011; 331:1565–70. https://doi.org/10.1126/science.1203486 [PubMed]
- 31. Chi LJ, Lu HT, Li GL, Wang XM, Su Y, Xu WH, Shen BZ. Involvement of T helper type 17 and regulatory T cell activity in tumour immunology of bladder carcinoma. Clin Exp Immunol. 2010; 161:480–89. https://doi.org/10.1111/j.1365-2249.2010.04215.x [PubMed]
- 32. Chanmee T, Ontong P, Konno K, Itano N. Tumor-associated macrophages as major players in the tumor microenvironment. Cancers (Basel). 2014; 6:1670–90. https://doi.org/10.3390/cancers6031670 [PubMed]
- 33. Hu B, Wang Z, Zeng H, Qi Y, Chen Y, Wang T, Wang J, Chang Y, Bai Q, Xia Y, Wang Y, Liu L, Zhu Y, et al. Blockade of DC-SIGN+ tumor-associated macrophages reactivates antitumor immunity and improves immunotherapy in muscle-invasive bladder cancer. Cancer Res. 2020; 80:1707–19. https://doi.org/10.1158/0008-5472.CAN-19-2254 [PubMed]
- 34. Zhou L, Xu L, Chen L, Fu Q, Liu Z, Chang Y, Lin Z, Xu J. Tumor-infiltrating neutrophils predict benefit from adjuvant chemotherapy in patients with muscle invasive bladder cancer. Oncoimmunology. 2017; 6:e1293211. https://doi.org/10.1080/2162402X.2017.1293211 [PubMed]
- 35. Bhattacharya S, Andorf S, Gomes L, Dunn P, Schaefer H, Pontius J, Berger P, Desborough V, Smith T, Campbell J, Thomson E, Monteiro R, Guimaraes P, et al. ImmPort: disseminating data to the public for the future of immunology. Immunol Res. 2014; 58:234–39. https://doi.org/10.1007/s12026-014-8516-1 [PubMed]
- 36. Mei S, Meyer CA, Zheng R, Qin Q, Wu Q, Jiang P, Li B, Shi X, Wang B, Fan J, Shih C, Brown M, Zang C, Liu XS. Cistrome cancer: a web resource for integrative gene regulation modeling in cancer. Cancer Res. 2017; 77:e19–22. https://doi.org/10.1158/0008-5472.CAN-17-0327 [PubMed]
- 37. Ritchie ME, Phipson B, Wu D, Hu Y, Law CW, Shi W, Smyth GK. Limma powers differential expression analyses for RNA-sequencing and microarray studies. Nucleic Acids Res. 2015; 43:e47. https://doi.org/10.1093/nar/gkv007 [PubMed]
- 38. Yue C, Ma H, Zhou Y. Identification of prognostic gene signature associated with microenvironment of lung adenocarcinoma. PeerJ. 2019; 7:e8128. https://doi.org/10.7717/peerj.8128 [PubMed]
- 39. Thomas PD. The gene ontology and the meaning of biological function. Methods Mol Biol. 2017; 1446:15–24. https://doi.org/10.1007/978-1-4939-3743-1_2 [PubMed]
- 40. Kanehisa M, Goto S. KEGG: kyoto encyclopedia of genes and genomes. Nucleic Acids Res. 2000; 28:27–30. https://doi.org/10.1093/nar/28.1.27 [PubMed]
- 41. Li T, Fan J, Wang B, Traugh N, Chen Q, Liu JS, Li B, Liu XS. TIMER: a web server for comprehensive analysis of tumor-infiltrating immune cells. Cancer Res. 2017; 77:e108–10. https://doi.org/10.1158/0008-5472.CAN-17-0307 [PubMed]