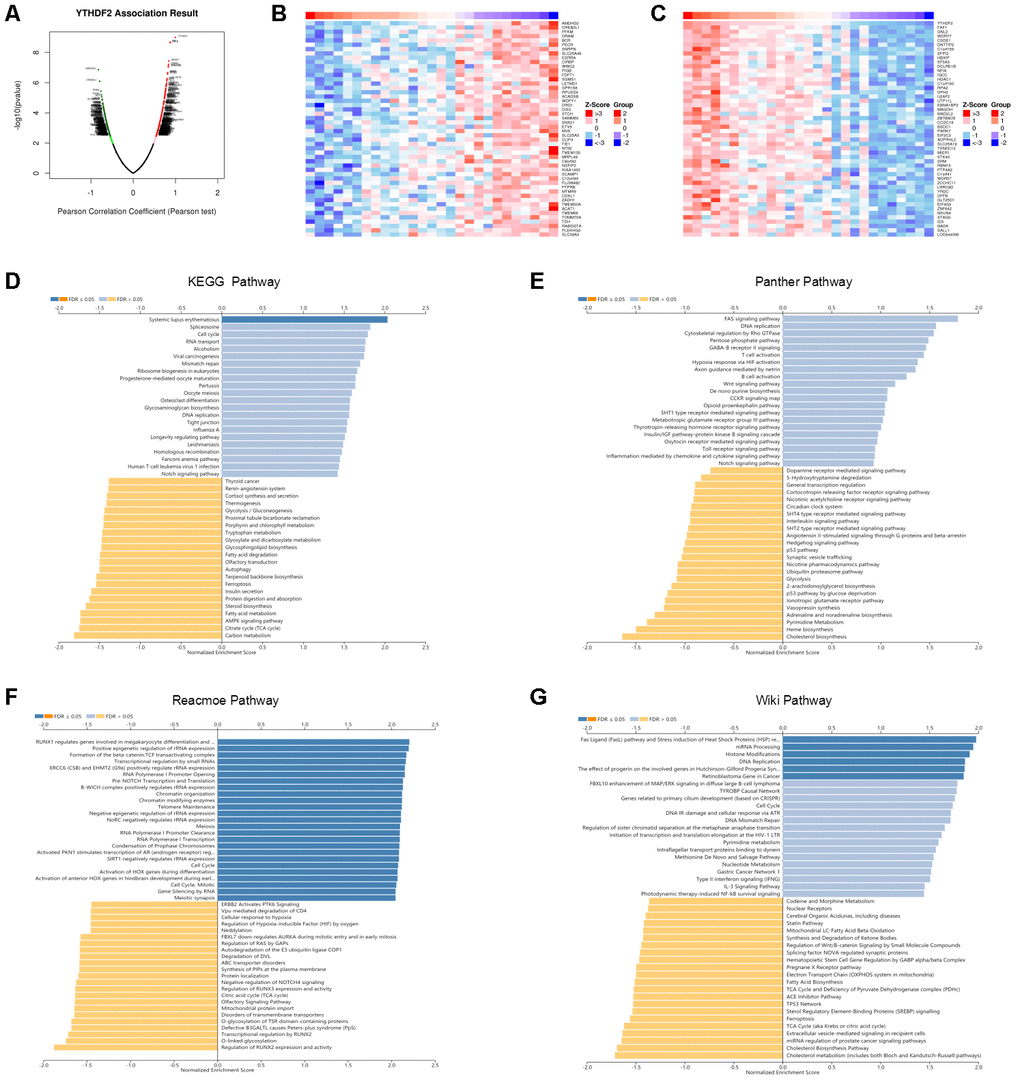
Figure 5.Enrichment analysis of YTHDF2 functional networks in LGG by LinkedOmics. (A) Volcano plot of genes differentially expressed in correlation with YTHDF2. (B, C) Heat maps of genes positively and negatively correlated with YTHDF2 (top 50). (D) KEGG pathway analysis of YTHDF2 by GSEA. (E) Panther pathway analysis of YTHDF2 by GSEA. (F) Reacmoe pathway analysis of YTHDF2 by GSEA. (G) Wiki pathway analysis of YTHDF2 by GSEA.