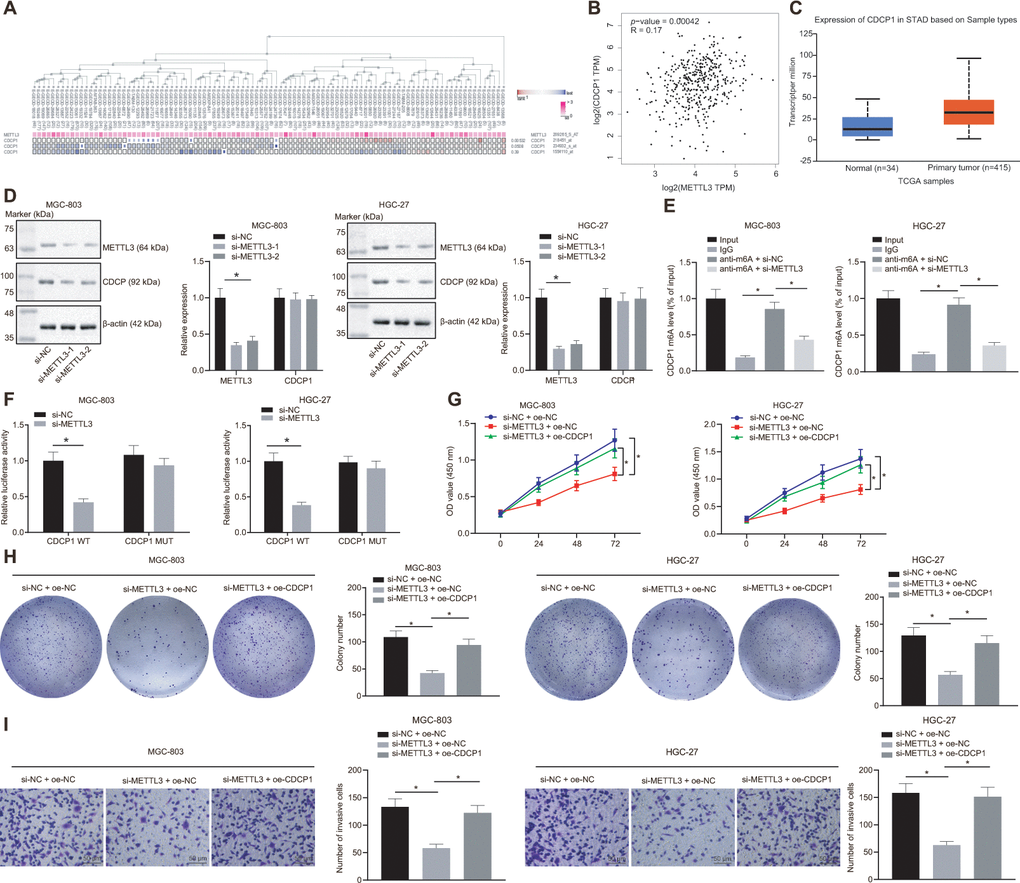
Figure 5.METTL3 modifies CDCP1 through m6A to elevate the CDCP1 expression, driving the proliferation and invasion of GC cells. (A) The co-expression map of METTL3 and CDCP1 obtained by MEM analysis (p = 5.32E-03; https://biit.cs.ut.ee/mem/index.cgi). (B) Correlation between METTL3 and CDCP1 expression obtained by GEPIA analysis (http://gepia2.cancer-pku.cn) of GC data (R = 0.17, p = 4.2E-04), absolute expression of mRNAs from GEPIA is presented. (C) Absolute CDCP1 expression in GC obtained by UALCAN. The blue box on the left represents the expression of normal samples, and the red box on the right represents the expression of GC samples. (D) Western blot assay and RT-qPCR to measure METTL3 and CDCP1 expression in MGC-803 and HGC-27 cells, with β-actin as internal control. (E) Me-RIP assay to examine m6A level of CDCP1 mRNA and enrichment after METTL3 knockdown. (F) Quantitative analysis for luciferase activity after METTL3 knockdown. (G) CCK-8 assay for cell viability in response to METTL3 knockdown and CDCP1 overexpression. (H) Colony formation assay to assess the number of colonies in response to METTL3 knockdown and CDCP1 overexpression. (I) Transwell assay to assess the number of invaded cells in response to METTL3 knockdown and CDCP1 overexpression. Measurement data are expressed as mean ± standard deviation. * p < 0.05. Unpaired t test was employed for data comparison between two groups. Data comparison among multiple groups was performed using one-way ANOVA with Tukey's post hoc test. Data comparison between groups at different time points was performed using two-way ANOVA or repeated-measures ANOVA with Bonferroni post hoc test. Cell experiments were repeated 3 times independently.
Figure 5 — Methylation of microRNA-338-5p by EED promotes METTL3-mediated translation of oncogene CDCP1 in gastric cancer | Aging