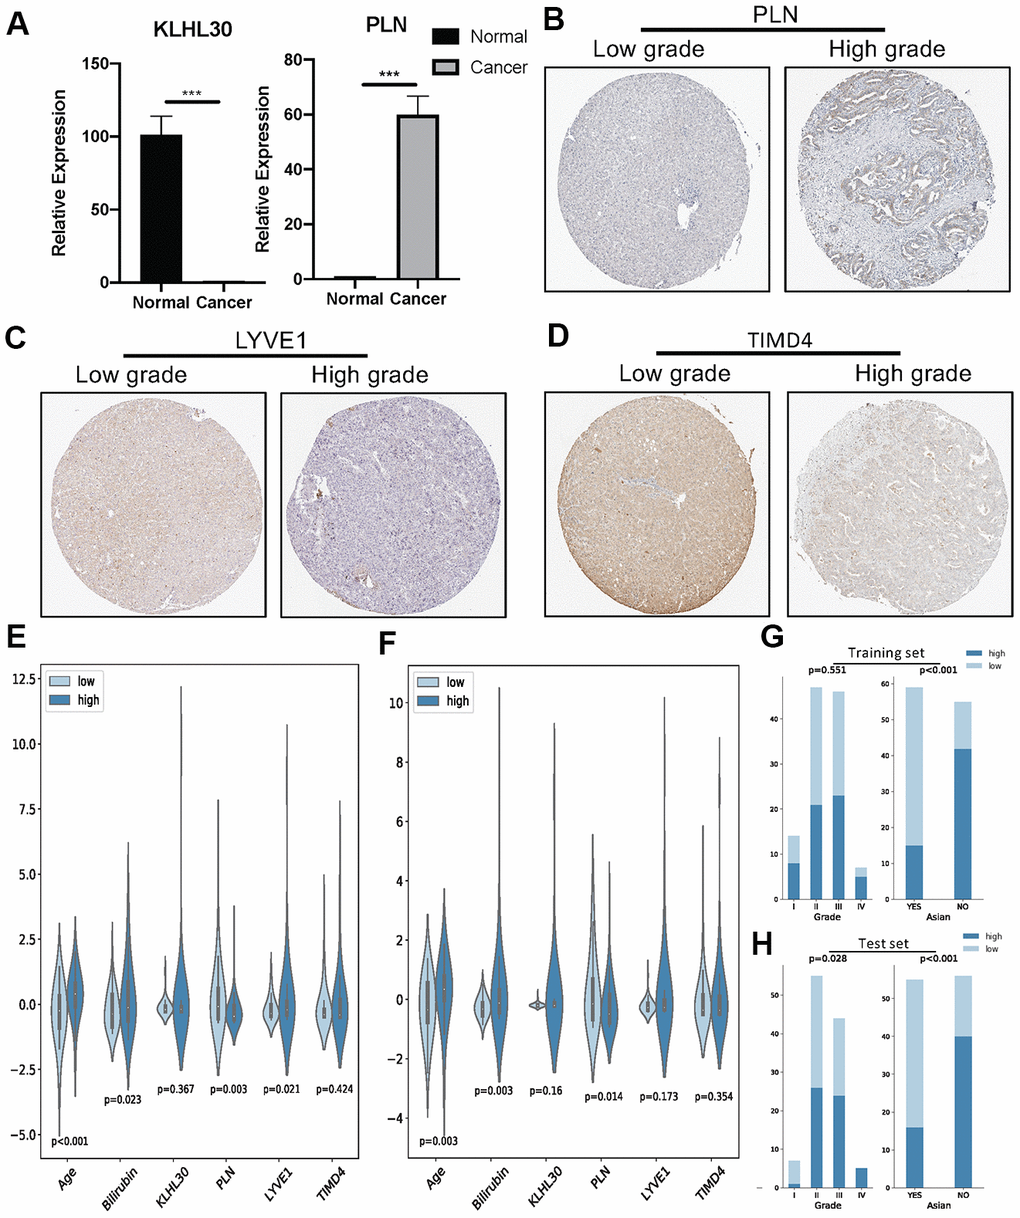
Figure 6.(A) QPCR analysis of KLHL30 and PLN in normal liver cell line and LIHC cell line (n = 3, ***P < 0.001, paired t test. (B–D) IHC results related to significant genes. (E) Nonparametric test (U test) for continuous variables and risk groups in the training set; P < 0.05 represents significant difference. (F) U test for continuous variables and risk groups in the test set; P < 0.05 represents significant difference. (G and H) Chi-square test for discrete variables and risk groups. (G) Training set. (H) Test sets. P < 0.05 represents a significant difference.