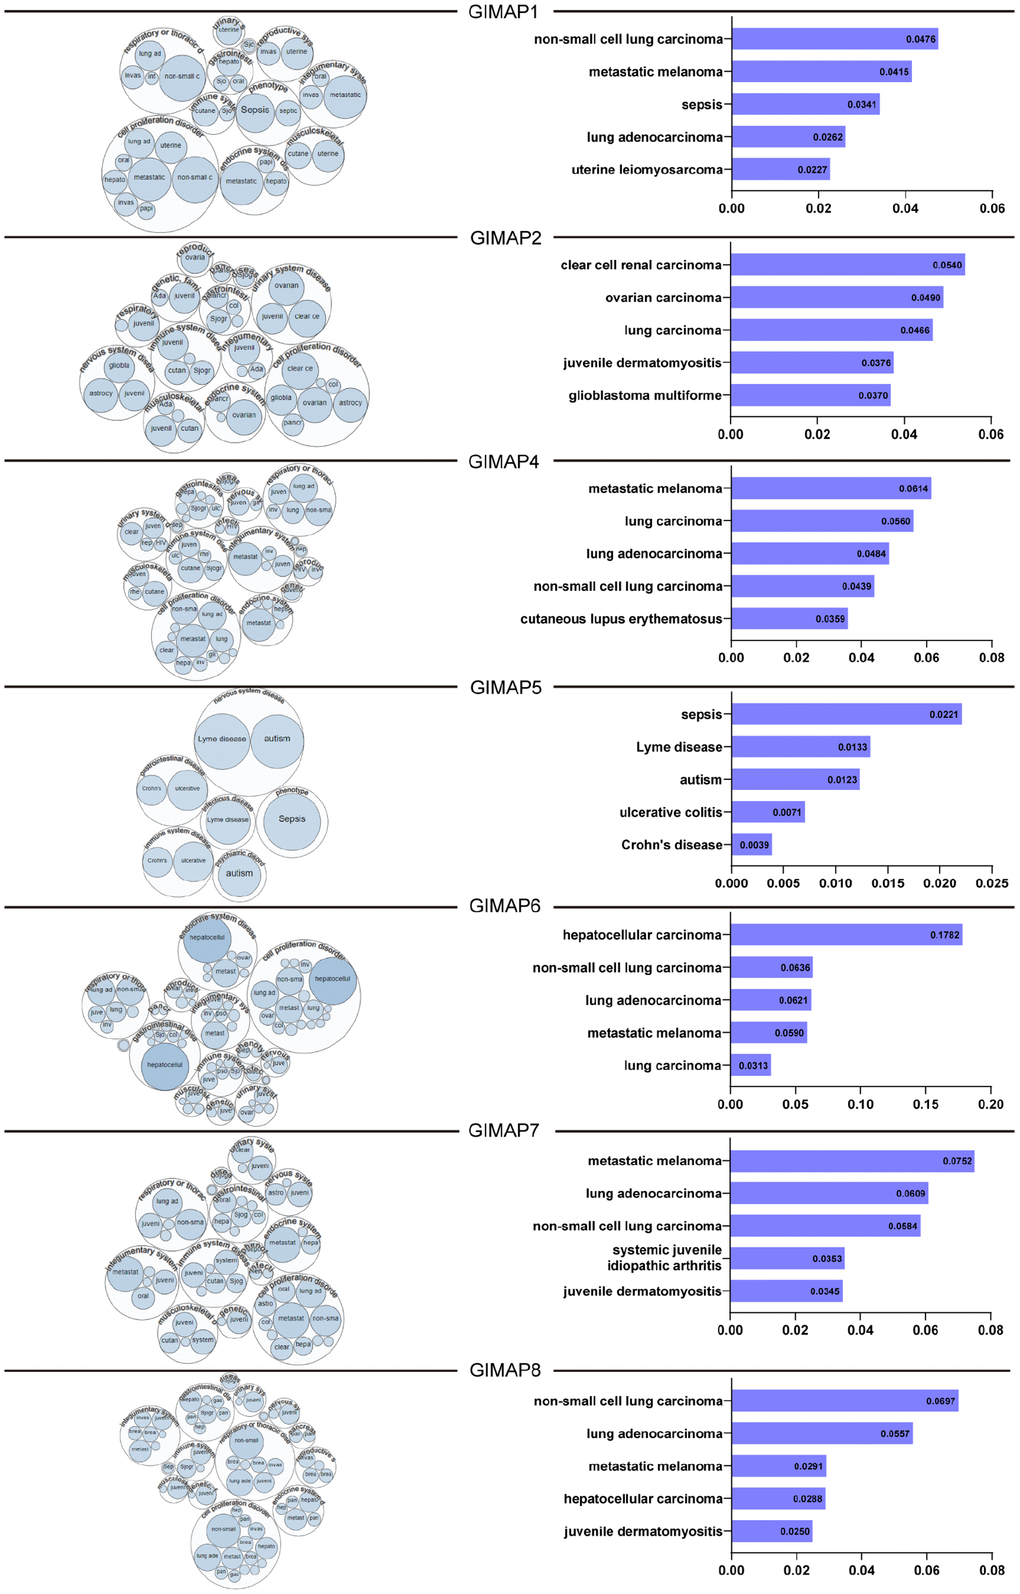
Figure 12.Relationship between GIMAPs with LUAD among the different disease (the Open Targets Platform). GIMAPs had a close relationship with LUAD and could be determined and visualized. The bubbles color and bubbles size represent the association score, and the top 5 diseases with a high score value are listed at right.