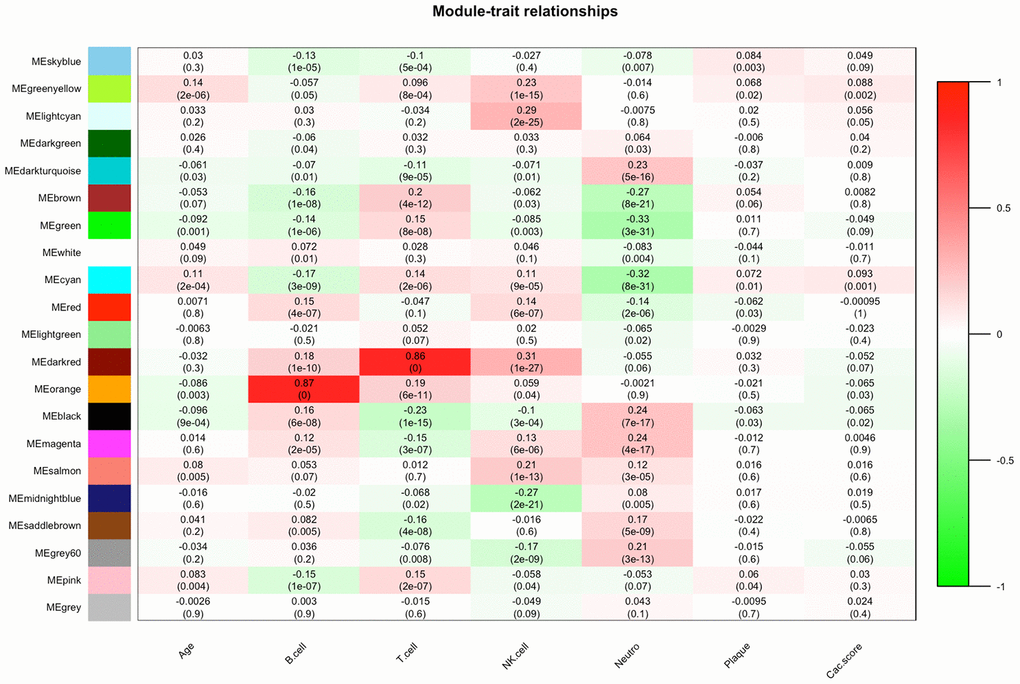
Figure 2.Module-feature associations. Each row corresponds to a module Eigengene, and each column to a clinical feature. Each cell contains the corresponding correlation in the first line and P-value in the second line. The table is color coded by correlation according to the color legend.