


Introduction
Coronary artery disease (CAD), according to incomplete statistics from the World Health Organization (WHO), still shows the highest incidence rate and mortality rate. With the improvement of living conditions, the incidence rate will continue to increase [1]. Many causes can lead to CAD. The most common reasons are uncontrolled blood pressure and serum, and an unhealthy lifestyle, such as smoking, drinking, mental stress and lack of sleep [2, 3]. The essence of CAD is coronary atherosclerosis. With the development of research technology, more studies have shown that atherosclerosis is a chronic inflammatory process [4]. Therefore, exploring the molecular mechanism related to coronary atherosclerosis may identify a very effective way to treat CAD.
During inflammation, the most obvious change in blood components is the sharp increase in the total number of white blood cells. Lymphocytes, the smallest type of white blood cell (WBC), is produced by lymphoid organs and is an important cell component of the immune response function of the body. Lymphocytes have immune recognition function and can be divided into T lymphocytes (also known as T cells), B lymphocytes (also known as B cells) and natural killer (NK) cells according to their migration, surface molecules and function [5]. Exploring the molecular mechanism of lymphocyte-mediated immune inflammation is becoming an important link in the prevention and treatment of CAD [6].
Advances in technology have led to a better understanding of the molecular mechanisms of disease onset. In the face of more gene sequencing data, choosing the most suitable analysis method is helpful [7], and weighted gene coexpression network analysis (WGCNA) can select the most directly related genes [8]. Presently, we detected the mRNA expression profile of WBC samples to identify highly connected hub genes and significant modules to show the potential molecular mechanisms.
Results
Data preprocessing
We obtained 47,280 probes from each sample expression profile in GSE56045. After data preprocessing, we obtained 20,918 probes containing gene symbols from 1,202 samples. The gene expression matrix was associated with the sample phenotype matrix for further analysis.
Weighted gene coexpression networks
After calculation, we believe that, when the correlation coefficient is 0.9 (soft threshold β is 4), the coexpression network has a higher correlation and is more suitable to construct different gene modules (Figure 1A). Together with the topological overlap matrix (TOM), we performed the hierarchical average linkage clustering method to identify the gene modules of each gene network (deepsplit = 2, cut height = 0.4) and then showed the heatmap in Figure 1B. Next, we calculated the gene cluster tree and showed the results in Figure 1D. Finally, about eleven gene modules should be handled by the dynamic tree cut (Figure 1C).
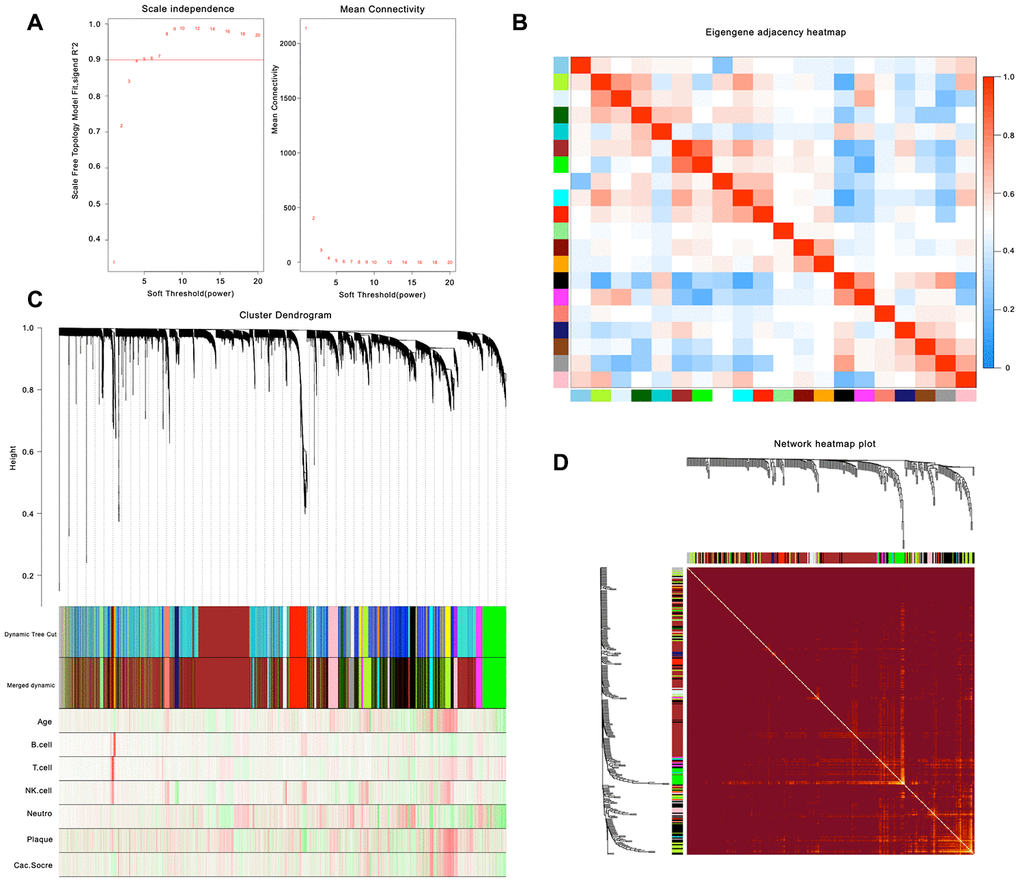
Figure 1. Weighted gene co-expression network analysis. (A) Analysis of network topology for various soft-thresholding powers. (B) Relationship among all the modules. (C) Clustering dendrogram of genes. Gene clustering tree (dendrogram) obtained by hierarchical clustering of adjacency-based dissimilarity. (D) Heatmap of the topological overlap in the gene network.
Interest module and functional annotation
As shown in Figure 2, the highest association in the module-feature relationship was the dark-red module and T cell (r2 = 0.86, P < 0.001), orange module and B cell (r2 = 0.87; P < 0.001). The dark-red module contains 121 genes, while the orange module contains 98 genes. All of these genes were showed in Supplementary Table 1. To determine the correlation between gene significance and color module, we conducted an in-depth calculation. As shown in Figure 3A, the correlation between the gene significance and orange module was 0.57 (P = 9E-10) and that of the dark red module was 0.28 (P = 0.0019). After confirming the correlation between the gene significance and modules, we analyzed the functional enrichment of the 219 genes in these two modules. Gene Ontology (GO) function, KEGG pathway enrichment and Disease Ontology analyses were performed by R (Figure 3B). The details of these analyses can be found in Supplementary Table 2. The biological processes of these two modules were found to be associated with GO:0042110-T cell activation (P = 4.89E-19), GO:0002768-immune response-regulating cell surface receptor signaling pathway (P = 4.66E-14), GO:0042113-B cell activation (P = 8.13E-07), and GO:0002699-positive regulation of immune effector process (P = 7.25E-05). However, in KEGG pathway analysis, these two modules were found to be associated with hsa04660-T cell receptor signaling pathway (P = 4.54E-09), hsa04060-Cytokine-cytokine receptor interaction (P = 6.87E-08), hsa04064-NF-kappa B signaling pathway (P = 2.38E-05), hsa04662-B cell receptor signaling pathway, and hsa04514-Cell adhesion molecules (CAMs) (P = 0.002).
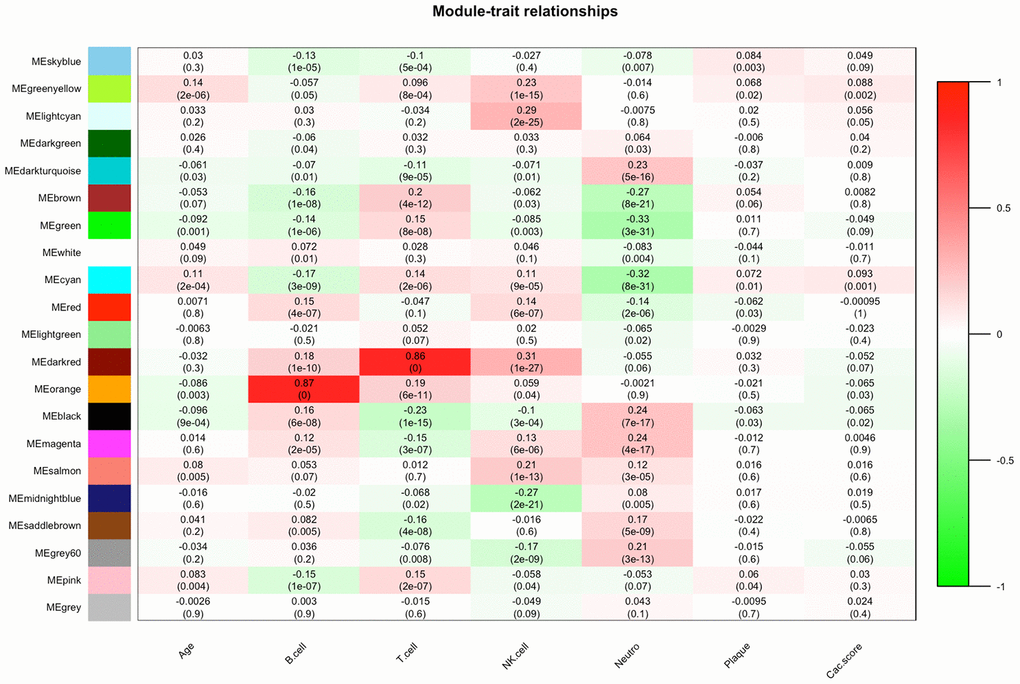
Figure 2. Module-feature associations. Each row corresponds to a module Eigengene, and each column to a clinical feature. Each cell contains the corresponding correlation in the first line and P-value in the second line. The table is color coded by correlation according to the color legend.
Protein-protein interaction (PPI) network construction and identification of hub genes
Approximately 149 nodes and 1,016 protein pairs were obtained when the combined weight score was set at more than 0.25 (Figure 3C-All). Analysis in the submodule revealed four modules with a score > 6 detected by MCODE (Figure 3C Cluster 1-4). After integrating the GO function, KEGG pathway enrichment and PPI analysis results, we identified several genes with a high degree and MCODE scores: PRF1, GZMB, CD27, CD2, CCL5, CXCR5, CD8A, CCR7, IL2RB, IFNG, CD40LG, IL7R, CD226, LAT, CD6, PLCG1, CD22, CCR4, TNFRSF13B, PRKCQ, LTB, LTA, STAT4, TNFRSF13C. Next, we needed to further verify these genes to determine their functional characteristics.
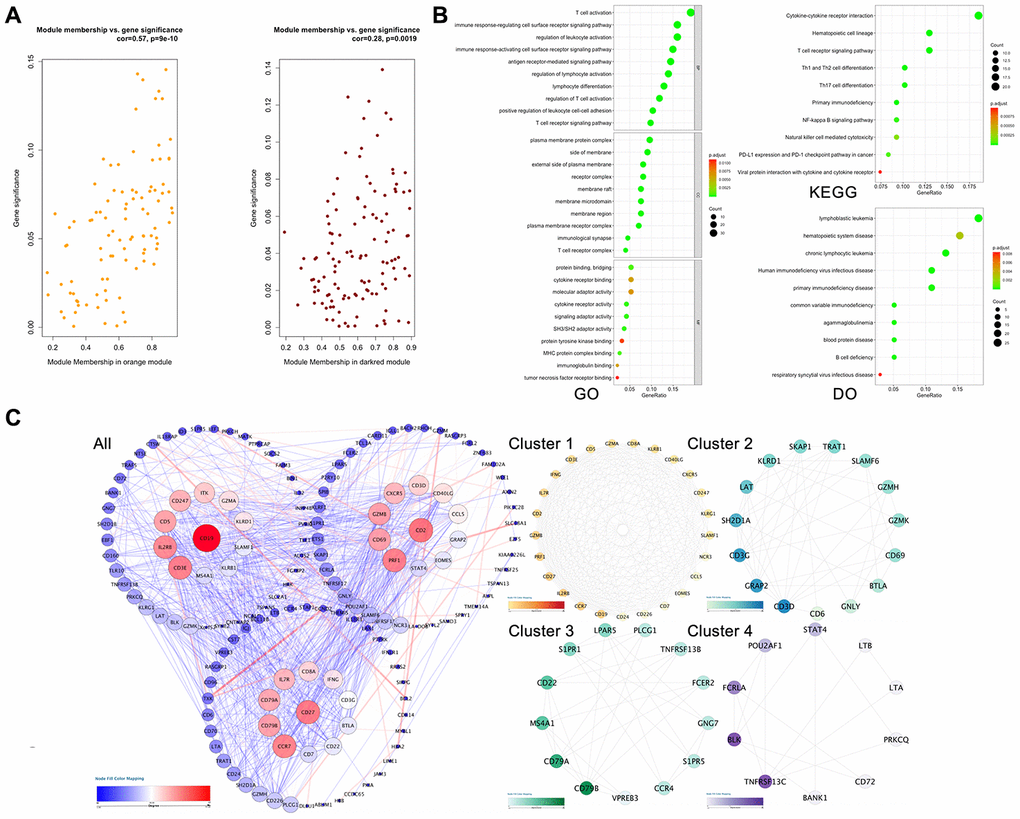
Figure 3. Hub gene screening process. (A) Association with gene significance and modules. The correlation between the module traits and the significance of gene expression. The higher the correlation, the higher the correlation between the gene expression in the module and the module trait. (B) Function annotation: (GO) Gene Ontology; (KEGG) Kyoto Encyclopedia of Genes and Genomes pathway enrichment; (DO) Disease Ontology; (C) Protein-protein interaction network of the selected genes. Edge stands for the interaction between two genes. A degree was used for describing the importance of protein nodes in the network, red shows a high degree and blue presents a low degree. The depth of the color represents the degree of correlation, and the deeper the color, the higher the correlation. The significant modules identified from the PPI using the molecular complex detection method with a score of >6.0. All: all of the genes; Cluster 1: MCODE-1= 12.07; Cluster 2: MCODE-2 = 9.92; Cluster 3: MOCDE-3 = 7.39; Cluster 4: MCODE-4 = 6.28.
Dataset validation
First, we analyzed the relationship between the expression level of these 24 genes and the coronary artery calcification score by linear correlation in GSE56045. As shown in Figure 4, only 4 gene expression levels were related to the coronary artery calcification score: CCR7 (R = -0.081, P = 0.0065), CD2 (R = -0.075, P = 0.0012), CXCR5 (R = -0.065, P = 0.029) and IL7R (R = -0.06, P = 0.043). Next, we tested the expression level and function of the four genes in different datasets to confirm whether they were closely related to CAD. As shown in Figure 5A, the expression levels of CCR7, CXCR5 and IL7R were different in the CAD and control group (P < 0.05–0.001), but no significant difference was found with CD2 (P = 0.41). In GSE34822 (Figure 5B), the expression of CCR7, CXCR5 and CD2 was different in progressive and stable plaques, while that of IL7R was not significantly different (P < 0.05–0.001). Additionally, the gene expression level of progressive plaques was lower than that of stable plaques. Figure 5C analyzes GSE129935, which revealed that only CCR7 and CXCR5 had statistical significance in the comparison of stability and acute myocardial infarction (AMI), stability and instability (P < 0.05–0.01). Additionally, the subsequent decrease in expression led to the occurrence of plaque instability, which leads to AMI. GSE60993 (Figure 5D) also well verified the previous conclusion. From this dataset, the expression of these four genes in the healthy control group was statistically significant compared with unstable angina (UA), non-ST elevation myocardial infarction (NSTEMI) and ST elevation myocardial infarction (STEMI) (P < 0.001), and the healthy control group had a higher expression level. GSE59867 (Figure 5E) reflected the change in gene expression from stable to the first day to six months after AMI. From this dataset, we found that only CCR7 and CXCR5 expression was statistically significant (P < 0.05–0.001), the expression level was the lowest on the first day after AMI, and the gene level gradually increased with time. By dividing the expression of CCR7 and CXCR5 in GSE59867 by the mean value, expression greater than the mean value was defined as high expression, and the occurrence of heart failure was defined as the end event. We found that, when CCR7 showed high expression and CXCR5 showed low expression, the occurrence of heart failure was 10.796 times higher than that of CCR7 and CXCR5 (P < 0.05) (Figure 5F). Based on the above five datasets, we believe that CCR7 and CXCR5 play an important role in atherosclerosis and plaque vulnerability. Further verification of these data in a future investigation is warranted.
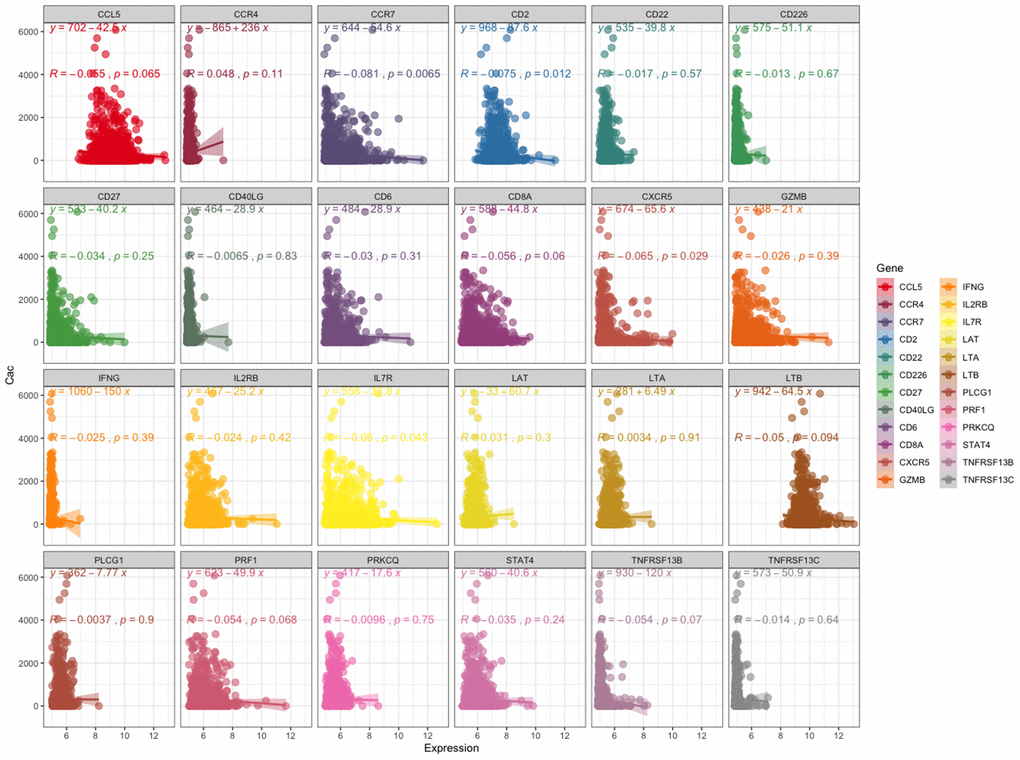
Figure 4. Relationship between the expression level of these 24 genes and coronary artery calcification score. The left panel shows the coronary artery calcification score (y-axis). The expression level of these 24 genes is shown on the x-axis.
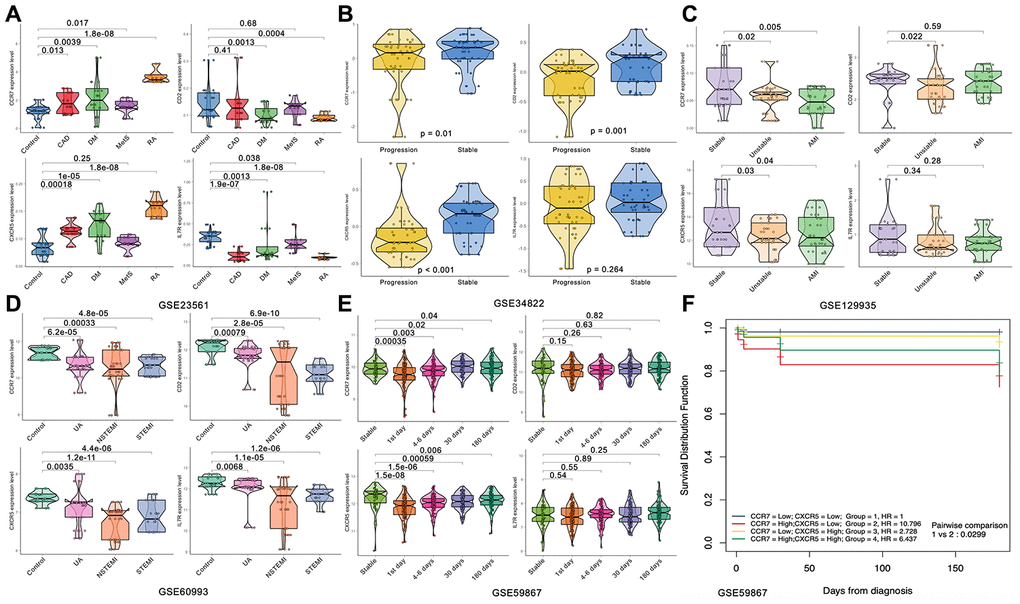
Figure 5. Expression of the four hub genes in different datasets. (A) GSE23561. (B) GSE34822. (C) GSE122935. (D) GSE60993. (E, F) GSE59867.
Subject validation
To verify the exact function of CCR7 and CXCR5, we collected the data of some patients hospitalized due to chest pain, measured the relative gene expression after collecting the peripheral blood, and compared the gene expression level according to the coronary angiography data. Table 1 shows the general situation of 1,528 patients with gender and age matching. We considered all the variable data, including the relative expression of CCR7 and CXCR5, gender, age, smoking, drinking, BMI, systolic blood pressure (SBP), diastolic blood pressure (DBP), serum glucose, TC, TG, high-density lipoprotein cholesterol (HDL-C), LDL-C, apolipoprotein (Apo)A1 and ApoB, which were the best subset of risk factors to develop the acute coronary syndrome (ACS) risk score and risk model (nomogram) (Figure 6). We defined the sores as follows: smoking and/or drinking: yes = 2, no = 1; male = 1; female = 2. The nomogram had excellent discriminative power with a C-statistic and was well calibrated with the Hosmer-Lemeshow χ 2 statistic. The predicted probabilities of developing ACS ranged from 0.0004 to 99%. The discrimination accuracy of the model was 0.841 (95% CI, 0.809–0.871). At an optimal cutoff value, the sensitivity and specificity were 64.0% and 90.9%, respectively.
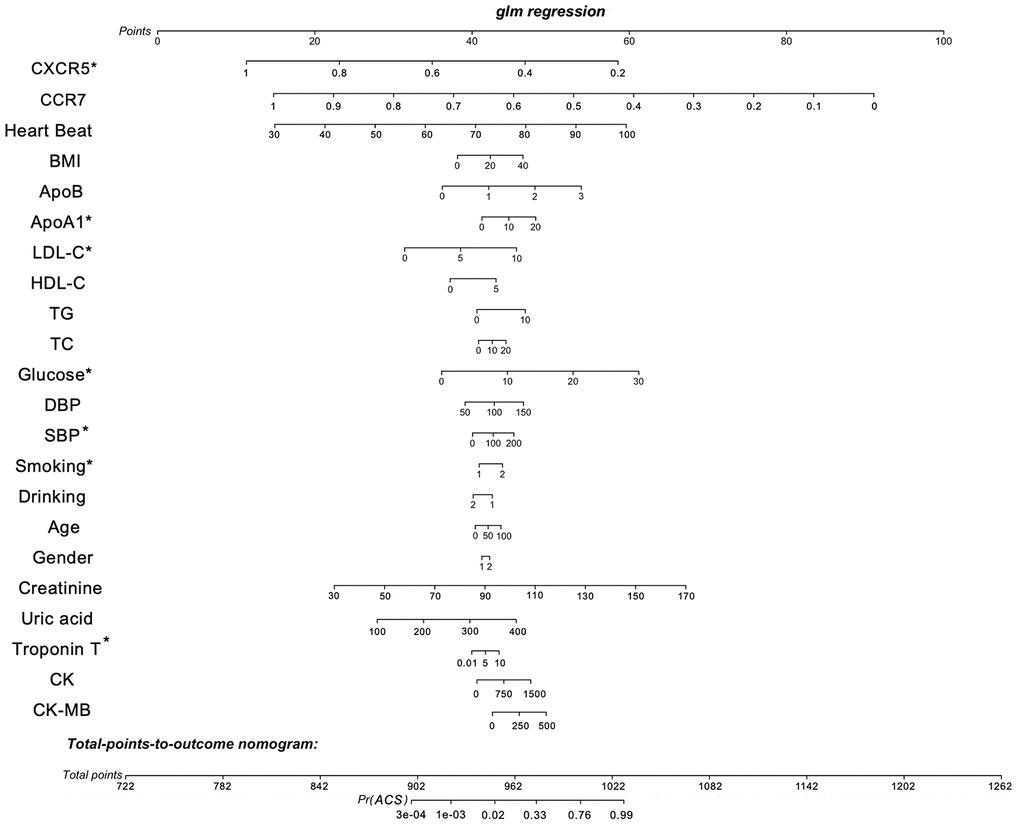
Figure 6. Nomogram to estimate individual ACS probability. Each predictor variable characteristic has a corresponding point value based on its position on the top point scale and contribution to the model. The probability of ACS for each subject is calculated by summing the points for each variable to obtain a total point value that corresponds to a probability of ACS from the scale presented on the bottom line. The variable data, including the relative expression of CCR7 and CXCR5, gender, age, smoking, drinking, BMI, systolic blood pressure (SBP), diastolic blood pressure (DBP), serum glucose, TC, TG, high-density lipoprotein cholesterol (HDL-C), LDL-C, apolipoprotein (Apo)A1, ApoB and defined the sores as follows: smoking and/or drinking: yes = 2, no = 1; male = 1; female = 2. The predictive accuracy of the risk model was assessed by discrimination measured by C-statistic and calibration evaluated by Hosmer-Lemeshow χ2 statistic. The discriminatory ability of the model was quantified using the area under the receiver operating characteristic curve (AUC). The discrimination accuracy of the model was 0.841 (95% CI, 0.809–0.871). At an optimal cutoff value, the sensitivity and specificity were 64.0% and 90.9%, respectively. *P < 0.05.
Table 1. Comparison of demographic, lifestyle characteristics and serum lipid levels among different groups.
| Parameter | Control | CAD | UA | NSTEMI | STEMI | ||||||||||||||||||||||||||||||||||||||||||||||||||||||||||||||||||||||||||||||||||||||||||||||
| Number | 312 | 320 | 304 | 290 | 302 | ||||||||||||||||||||||||||||||||||||||||||||||||||||||||||||||||||||||||||||||||||||||||||||||
| Male/female | 94/220 | 89/231 | 92/210 | 84/202 | 98/202 | ||||||||||||||||||||||||||||||||||||||||||||||||||||||||||||||||||||||||||||||||||||||||||||||
| Age (years)1 | 55.32±8.31 | 54.16±9.05 | 55.59±8.54 | 56.43±9.83 | 55.94±9.17 | ||||||||||||||||||||||||||||||||||||||||||||||||||||||||||||||||||||||||||||||||||||||||||||||
| Height (cm) | 166.24±6.82 | 168.59±7.29 | 167.55±7.28 | 166.52±6.94 | 167.23±9.13 | ||||||||||||||||||||||||||||||||||||||||||||||||||||||||||||||||||||||||||||||||||||||||||||||
| Weight (kg) | 52.46±6.84 | 54.74±10.82 | 57.63±9.11a | 57.92±8.77a | 57.52±9.23a | ||||||||||||||||||||||||||||||||||||||||||||||||||||||||||||||||||||||||||||||||||||||||||||||
| Body mass index (kg/m2) | 29.29±5.13 | 30.44±6.47a | 30.67±7.12a | 30.79±6.74a | 30.77±6.09a | ||||||||||||||||||||||||||||||||||||||||||||||||||||||||||||||||||||||||||||||||||||||||||||||
| Waist circumference (cm) | 74.49±6.74 | 73.55±9.48 | 76.03±8.15 | 76.24±7.17 | 76.15±6.27 | ||||||||||||||||||||||||||||||||||||||||||||||||||||||||||||||||||||||||||||||||||||||||||||||
| Smoking status [n (%)] | 81(26.0) | 114(35.6) a | 142(46.7) a | 138(47.6) a | 144(47.6) a | ||||||||||||||||||||||||||||||||||||||||||||||||||||||||||||||||||||||||||||||||||||||||||||||
| Alcohol consumption [n (%)] | 75(24.0) | 84(26.2) | 70(23.0) | 81(27.9) a | 71(23.5) | ||||||||||||||||||||||||||||||||||||||||||||||||||||||||||||||||||||||||||||||||||||||||||||||
| SBP (mmHg) | 124.14±17.14 | 129.21±21.11a | 147.15±23.96c | 139.47±22.14b | 103.45±17.16c | ||||||||||||||||||||||||||||||||||||||||||||||||||||||||||||||||||||||||||||||||||||||||||||||
| DBP (mmHg) | 80.52±11.16 | 81.33±11.25 | 88.54±14.23a | 84.43±11.21 | 68.54±12.15c | ||||||||||||||||||||||||||||||||||||||||||||||||||||||||||||||||||||||||||||||||||||||||||||||
| PP (mmHg) | 49.64±14.13 | 51.42±13.59 | 51.66±15.24 | 50.84±15.22 | 50.22±14.21 | ||||||||||||||||||||||||||||||||||||||||||||||||||||||||||||||||||||||||||||||||||||||||||||||
| Glucose (mmol/L) | 5.91±1.83 | 6.13±2.22 | 7.79±2.43b | 8.46±2.79c | 8.69±2.78c | ||||||||||||||||||||||||||||||||||||||||||||||||||||||||||||||||||||||||||||||||||||||||||||||
| TC (mmol/L) | 4.93±1.21 | 5.21±1.17a | 5.63±1.12a | 5.99±1.18a | 5.83±1.43a | ||||||||||||||||||||||||||||||||||||||||||||||||||||||||||||||||||||||||||||||||||||||||||||||
| TG (mmol/L)2 | 1.49(0.51) | 1.53(1.22) | 1.52(1.21) | 1.44(1.32) | 1.51(1.26) | ||||||||||||||||||||||||||||||||||||||||||||||||||||||||||||||||||||||||||||||||||||||||||||||
| HDL-C (mmol/L) | 1.52±0.44 | 1.32±0.26a | 1.35±0.34a | 1.44±0.28a | 1.48±0.32 | ||||||||||||||||||||||||||||||||||||||||||||||||||||||||||||||||||||||||||||||||||||||||||||||
| LDL-C (mmol/L) | 2.86±0.81 | 3.23±0.74a | 3.98±0.79a | 3.79±0.88a | 3.92±0.84a | ||||||||||||||||||||||||||||||||||||||||||||||||||||||||||||||||||||||||||||||||||||||||||||||
| ApoA1 (g/L) | 1.24±0.24 | 1.17±0.22 | 1.18±0.26 | 1.18±0.26 | 1.14±0.28 | ||||||||||||||||||||||||||||||||||||||||||||||||||||||||||||||||||||||||||||||||||||||||||||||
| ApoB (g/L) | 0.84±0.19 | 0.82±0.32 | 0.81±0.31 | 0.94±0.31 | 0.88±0.28 | ||||||||||||||||||||||||||||||||||||||||||||||||||||||||||||||||||||||||||||||||||||||||||||||
| ApoA1/ApoB | 1.67±0.50 | 1.66±0.57 | 1.64±0.58 | 1.65±0.61 | 1.67±0.54 | ||||||||||||||||||||||||||||||||||||||||||||||||||||||||||||||||||||||||||||||||||||||||||||||
| Heart rate (beats/minutes) | 72.41±10.19 | 72.33±10.32 | 76.28±10.61a | 76.43±9.31a | 79.76±10.14a | ||||||||||||||||||||||||||||||||||||||||||||||||||||||||||||||||||||||||||||||||||||||||||||||
| Creatinine, (μmol/L) | 72.34±12.22 | 71.36±11.34 | 74.53±11.62 | 76.55±10.23 | 76.58±12.74 | ||||||||||||||||||||||||||||||||||||||||||||||||||||||||||||||||||||||||||||||||||||||||||||||
| Uric acid, (μmol/L) | 283.83±76.19 | 286.89±74.32 | 279.88±81.31 | 285.91±81.31 | 283.86±75.28 | ||||||||||||||||||||||||||||||||||||||||||||||||||||||||||||||||||||||||||||||||||||||||||||||
| Troponin T, (μg/L) | 0.01±0.02 | 0.02±0.02 | 0.02±0.01 | 2.74±3.93c | 2.86±6.28c | ||||||||||||||||||||||||||||||||||||||||||||||||||||||||||||||||||||||||||||||||||||||||||||||
| CK, (U/L) | 88.84±45.28 | 87.84±48.31 | 91.88±50.33 | 1111.92±683.31c | 1124.88±783.28c | ||||||||||||||||||||||||||||||||||||||||||||||||||||||||||||||||||||||||||||||||||||||||||||||
| CKMB, (U/L) | 12.44±3.63 | 13.11±2.78 | 13.22±3.32 | 129.88±61.45c | 132.76±59.17c | ||||||||||||||||||||||||||||||||||||||||||||||||||||||||||||||||||||||||||||||||||||||||||||||
| CAD, coronary artery disease; UA, unstable angina; NSTEMI, on-ST-segment elevation myocardial infarction; STEMI, ST-segment elevation myocardial infarction; SBP, systolic blood pressure; DBP, diastolic blood pressure; PP, pulse pressure; TC, total cholesterol; TG, triglyceride; HDL-C, high-density lipoprotein cholesterol; LDL-C, low-density lipoprotein cholesterol; Apo, Apolipoprotein. 1Mean ± SD determined by t-test.2Because of not normally distributed, the value of triglyceride was presented as median (interquartile range), the difference between the two groups was determined by the Wilcoxon-Mann-Whitney test. The P value was defined as the comparison of case and control groups. aP < 0.05; bP < 0.01; cP < 0.001. | |||||||||||||||||||||||||||||||||||||||||||||||||||||||||||||||||||||||||||||||||||||||||||||||||||
After calculation, the relative expression of levels of CXCR5, ApoA1, LDL-C, serum glucose, smoking and Troponin T were significantly related to the risk of ACS, with statistical significance. The relative expression of peripheral blood RT–PCR showed that the expression of CXCR5 was statistically significant in the comparison of cases (including UA, NSTEMI and STEMI) and controls, and the expression decreased gradually with the increase in plaque vulnerability (Figure 7), a finding that was also consistent with the results of previous multidatasets.
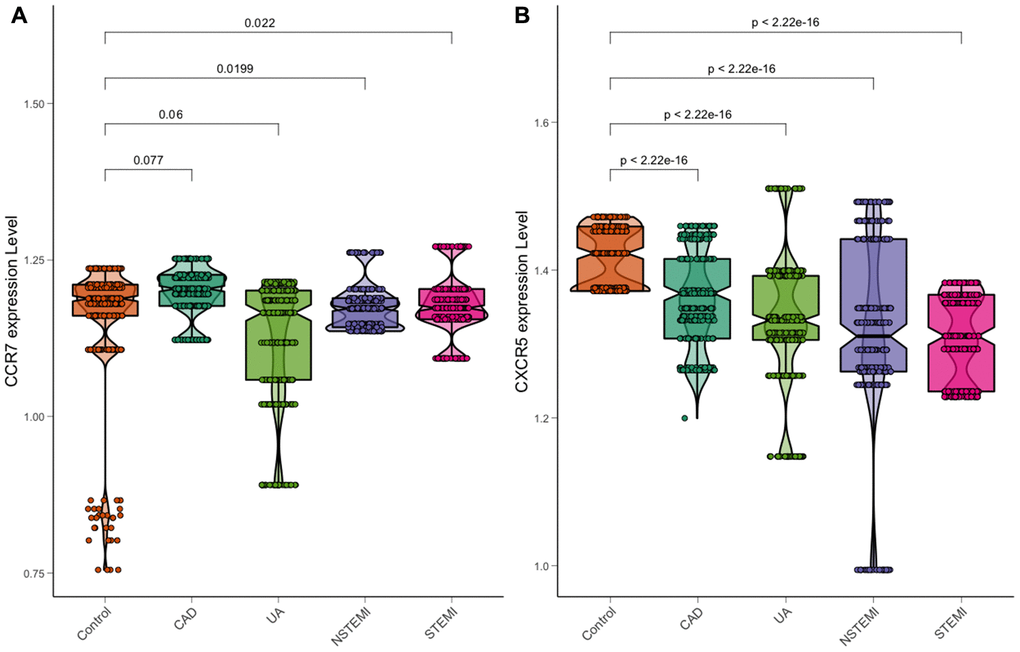
Figure 7. Expression of CCR7 and CXCR5 in a chest pain patient. (A) CCR7. (B) CXCR5.
Discussion
Previously, the main cause of arteriosclerosis was considered the formation of atherosclerotic plaques caused by abnormal serum lipids. However, in recent years, with more extensive research, researchers have gradually realized that arteriosclerosis is a chronic inflammatory process with intense immune activity [9]. More evidence has also shown that LDL has synergistic effects with an immune inflammatory response, which promotes the formation of atherosclerosis. Considering blood lipid control alone, we have efficient tools to reduce LDL and the occurrence of cardiovascular adverse events (MACE). However, even if LDL is greatly reduced, MACE will still occur. This residual risk can be explained by the immune inflammatory response. Clear inflammatory interventions have now been shown to improve the prognosis of individuals treated with LDL-lowering drugs [10].
Previously, T and B cells were found in the detection of atherosclerotic plaques, which opened the door to the study of the autoimmune response leading to atherosclerosis [11]. Furthermore, the rate of APC-CD4 + T-helper cell interaction in atherosclerotic plaques of mice was increased, especially in hypercholesterolemia, leading to the secretion of pro-inflammatory cytokines [12]. Additionally, in lymph node biopsy, we found that auxiliary T cells gradually matured into antigen empirical effect/memory (TEM) and central memory (TCM) T cells, also observed in atherosclerotic plaques [13]. The sustained enhanced activation of T cells was accompanied by the expansion of lymph nodes in atherosclerotic ApoE - / - mice, as well as the local and systemic pro-inflammatory response, to further enhance the diet induced by hypercholesterolemia. These findings support the concept that specific antigens drive immune responses in the aorta and lymph nodes during atherosclerosis [14].
C-X-C motif chemokine receptor 5 (CXCR5), as a member of the CXC chemokine receptor family, encodes a multipass membrane protein. Recently, we identified characteristic CXCR5+-expressing follicular helper T cells (Tfh), a multifunctional helper T-cell subpopulation that helps B cells to differentiate into plasma membrane [15]. More evidence has shown that Tfh cells are also related to various inflammatory diseases, and an increased number of Tfh cells is found in CAD [16]. Through further experiments, we found that the circulating CD4 + CXCR5 + T cells in patients with CAD are rich in PD-1 + CCR7- subsets, which can secrete IFN - γ, IL-17A and IL-21 in large quantities. Additionally, CD4 + CXCR5 + T cells in patients with CAD showed a stronger ability to stimulate the flow of B cells than that in healthy people. In coincubated B cells, the expression of IL-6 and IFN - γ also increased significantly, which may be the possible mechanism of CXCR5-induced arteriosclerosis [17]. Van der Vorst EPC et al found that CXCL13-CXCR5 chemokine axis plays an important role in the occurrence and development of atherosclerosis. The most likely reason is that the production and secretion of IgM protecting atherosclerosis by regulating the distribution pattern of B1 cells [18]. After further analysis of the expression quantitative feature loci of the gene expression data set, the G allele of rs77564610 and high expression of CXCR5 in the whole blood were found to be closely related to the high risk of myocardial infarction [19]. However, common variations of CXCR5 (50 kb) were found in the British biological bank cohort; the allele mutations of rs187248852 and rs73575424 are related to the pathogenesis of ischemic stroke and myocardial infarction, respectively [20]. This finding was consistent with ours.
This study possessed limitations. First, the patients enrolled to validate the relative expression in this study were from only one hospital, and the sample size was small. Whether there is a difference in patients from different areas and races is not known. Therefore, the validity of the findings should be tested in more prospective cohorts. Second, although we carried out many validations in other expression datasets and patients, the mechanism of CXCR5 leading to atherosclerosis and plaque vulnerability remains unclear and needs further verification through more detailed in vivo and in vitro experiments.
In conclusion, we explored the molecular mechanism of ACS by performing weighted gene coexpression networks analysis. After functional and protein-protein interaction analysis, 24 genes were identified with a significant meaning. We further validated these genes in GSE23561, GSE34822, GSE59867, GSE60993 and GSE129935 datasets and found CCR7 and CXCR5 as the hub genes. Next, we validated these two genes in chest pain patients and found that CXCR5 may play key role in atherosclerosis and plaque vulnerability; however, further confirmation is needed to validate the findings.
Materials and Methods
Microarray data
All dataset analyses were performed using R software (version 3.60). We downloaded GSE56045 [21] microarray data from GEO (Gene Expression Omnibus, http://www.ncbi.nlm.nih.gov/geo/). These datasets were based on the platform of the GPL10558 Illumina HumanHT-12 V4.0 expression BeadChip. GSE56045 contains 1,202 peripheral blood samples, as well as clinical information, such as age, whole-blood cell count, and the coronary artery calcification plaque score. First, we added CEL files into the R software using the Affy package for transformation into an expression value matrix. The probe information was then transformed into gene names using the Bioconductor package. The mean value should be chosen when a gene had more than one probe [22]. The preprocessing process of the datasets (GSE23561, GSE34822, GSE59867 and GSE60993) [23–27] used for validation was the same as that for GSE56045. GSE129935 was performed by Fragments Per Kilobase per Million mapped reads (FPKM) and quantile normalized using the robust multiarray average (RMA) method. The probes were then annotated using Bioconductor in R. GSE129935 was also used for validation.
Weighted gene coexpression network analysis
We conducted the analyses in strict accordance with the weighted gene coexpression network analysis process [28]. First, we chose the appropriate soft threshold power according to standard scale-free networks, with which adjacencies between all differential genes were calculated by a power function. Next, a topological overlap matrix (TOM) was derived from the adjacencies, and the corresponding dissimilarity (1-TOM) was counted. To complete the module recognition, we used the dynamic tree cutting method to cluster the genes in layers, using 1-TOM as the distance measure, a minimum size cutoff of 30, and a deepSplit value of cutting of 2. Next, we selected the highly similar modules by clustering and merged them, with the height line set as 0.4. To test the stability of each identified module, module preservation and quality statistics were computed using the module preservation function implemented in the WGCNA package [28]. Because the genes in the gray module cannot be attributed to any other module, all the genes in the gray module were removed.
Interest module and hub gene
We selected the module with the highest correlation with clinical features and the genes in this module with the important biological functions. To identify the most biologically significant module, we used Pearson correlation analysis to evaluate the correlation between clinical features and gene modules. We selected the most relevant modules related to clinical features for further analysis and research. Gene Ontology (GO) and Kyoto Encyclopedia of Genes and Genomes (KEGG) pathway analyses were performed to detect potential mechanisms by which these module genes affect correlative clinical features. The thresholds for the P value and false discovery rate (FDR) were set as less than 0.01 and 0.05, respectively. These analyses were completed using clusterProfiler and DOSE package in R [29].
We describe the correlation between the gene expression profile and module eigengenes (Mes) defined as the module membership (MM). The gene significance (GS) can be defined as the absolute value of the correlation between external traits and the gene. The genes of interest in the modules with the highest MM and GS scores were selected for subsequent analysis. We defined the GS and MM scores as more than 0.2 and 0.6, respectively, for intramodular hub genes selected by external traits, and the P cutoff value is set at less than 0.05. The STRING database (https://string-db.org/, Version 11.0) [30] was employed to analyze the protein-protein interaction (PPI) network. We used Cytoscape software (version 3.80) to visualize and construct the gene-gene interaction network. Additionally, we used the Molecular Complex Detection (MCODE) app to screen the most notable clustering modules, with an MCODE score greater than 6 set as the threshold for further analysis [31].
Hub gene validation and survival analysis
Our validation analysis was divided into two stages. In the first stage, we analyzed the function of the hub genes in different datasets; in the second stage, we verified the population. After collecting the patients admitted for chest pain, we extracted the peripheral blood and verified the expression of core genes. GSE23561, GSE34822, GSE59867, GSE60993 and GSE129935 were employed for validation. At first, we analyzed the correlation between the gene expression level and calcification score. Next, we compared the expression differences of hub genes among different groups and showed the results using the ggplot2 package in R. Subsequently, the “survival” package [32] in R was used to perform overall survival (heart failure) and disease-free survival analyses for all hub genes. The patients were divided into four groups (high vs. low) based on the hub gene expression level compared with the mean expression level of that hub gene. A Kaplan–Meier survival plot was also constructed. The ‘rms’ package was used for ACS prediction nomogram. The predictive accuracy of the risk model was assessed by discrimination measured by C-statistic and calibration evaluated by Hosmer-Lemeshow χ2 statistic. The discriminatory ability of the model was quantified using the area under the receiver operating characteristic curve (AUC). A 95% CI was calculated for each AUC. In general, an AUC > 0.75 was considered to be relatively good discrimination.
Study population
In total, 1,528 patients were recruited from the inpatient department for a complaint of chest discomfort at the Liuzhou People's Hospital from 2018-3-1 to 2019-12-31 and had undergone coronary angiography. CAD, UA and AMI were diagnosed based on the Fourth Universal Definition of Myocardial Infarction (2018) [33]. Exclusion criteria included subjects with poor compliance, incomplete clinical data, contrast agent sensitivity and autoimmune diseases. Additionally, subjects with obvious surgical contraindications were excluded. Clinical data collection, biochemical measurements and diagnostic criteria were performed according to previous studies [34]. The study adhered to the Declaration of Helsinki of 1975 (http://www.wma.net/en/30publications/10policies/b3/) and its revision in 2008 and the Ethics Committee of Liuzhou People's Hospital agreed with the study design (No: Lunshen-2018-KY; Feb. 12, 2018). Informed consent was obtained from all subjects after receiving a full explanation of the study.
RT–qPCR and statistical analysis
The procedures of blood sample collection, RNA isolation, reverse transcription cDNA and RT–qPCR are the same as those in our previous studies and were carried out in strict accordance with the product instructions and laboratory operating procedures [35]. The specific divergent primers were designed to amplify the transcripts and are shown in Supplementary Table 3. The statistical software package SPSS 22.0 (SPSS Inc., Chicago, IL, USA) and R software (version 3.6.0) were used for statistical analysis. Quantitative variables were expressed as means ± standard deviation (TG levels were shown as medians and interquartile ranges and were analyzed by the Wilcoxon–Mann–Whitney test because they were not a normal distribution). Chi-square analysis was used to assess the difference in the percentages between the groups. All tests were two-sided, and P < 0.05 was considered statistically significant.
Ethics approval
This analysis of publicly available data does not require ethical approval.
Author Contributions
Y.W. and L.M. conceived the study, participated in the design, performed the statistical analyses, and drafted the manuscript. R.-S.L. conceived the study, participated in the design and helped to draft the manuscript. C.-M.Z., J.-H.C., L.T. and B.Q. drafted the paper. F.L. and Y.L. revised the paper. All authors read and approved the final manuscript.
Acknowledgments
The authors thank all investigators for sharing these data.
Conflicts of Interest
The authors have no potential conflicts of interest to report.
Funding
The authors acknowledge the essential role of the funding of Guangxi self-financing research projects (Z20180318, Z20190025, Z20190137 and Z20170654), Guangxi Medical and health key discipline construction project and the project of Liuzhou people's Hospital (LRY202007).
References
- 1. Benjamin EJ, Virani SS, Callaway CW, Chamberlain AM, Chang AR, Cheng S, Chiuve SE, Cushman M, Delling FN, Deo R, de Ferranti SD, Ferguson JF, Fornage M, et al, and American Heart Association Council on Epidemiology, and Prevention Statistics Committee, and Stroke Statistics Subcommittee. Heart disease and stroke statistics-2018 update: a report from the American heart association. Circulation. 2018; 137:e67–e492. https://doi.org/10.1161/CIR.0000000000000558 [PubMed]
- 2. Miao L, Yin RX, Zhang QH, Liao PJ, Wang Y, Nie RJ, Li H. A novel circRNA-miRNA-mRNA network identifies circ-YOD1 as a biomarker for coronary artery disease. Sci Rep. 2019; 9:18314. https://doi.org/10.1038/s41598-019-54603-2 [PubMed]
- 3. Chiu MH, Heydari B, Batulan Z, Maarouf N, Subramanya V, Schenck-Gustafsson K, O’Brien ER. Coronary artery disease in post-menopausal women: are there appropriate means of assessment? Clin Sci (Lond). 2018; 132:1937–52. https://doi.org/10.1042/CS20180067 [PubMed]
- 4. Wang X, Guo Z, Ding Z, Mehta JL. Inflammation, autophagy, and apoptosis after myocardial infarction. J Am Heart Assoc. 2018; 7:e008024. https://doi.org/10.1161/JAHA.117.008024 [PubMed]
- 5. Siedlinski M, Jozefczuk E, Xu X, Teumer A, Evangelou E, Schnabel RB, Welsh P, Maffia P, Erdmann J, Tomaszewski M, Caulfield MJ, Sattar N, Holmes MV, Guzik TJ. White blood cells and blood pressure: a mendelian randomization study. Circulation. 2020; 141:1307–17. https://doi.org/10.1161/CIRCULATIONAHA.119.045102 [PubMed]
- 6. Ridker PM, Everett BM, Thuren T, MacFadyen JG, Chang WH, Ballantyne C, Fonseca F, Nicolau J, Koenig W, Anker SD, Kastelein JJ, Cornel JH, Pais P, et al, and CANTOS Trial Group. Antiinflammatory therapy with canakinumab for atherosclerotic disease. N Engl J Med. 2017; 377:1119–31. https://doi.org/10.1056/NEJMoa1707914 [PubMed]
- 7. Miao L, Yin RX, Zhang QH, Hu XJ, Huang F, Chen WX, Cao XL, Wu JZ. Integrated DNA methylation and gene expression analysis in the pathogenesis of coronary artery disease. Aging (Albany NY). 2019; 11:1486–500. https://doi.org/10.18632/aging.101847 [PubMed]
- 8. Miao L, Yin RX, Pan SL, Yang S, Yang DZ, Lin WX. Weighted gene co-expression network analysis identifies specific modules and hub genes related to hyperlipidemia. Cell Physiol Biochem. 2018; 48:1151–63. https://doi.org/10.1159/000491982 [PubMed]
- 9. Liu Y, Reynolds LM, Ding J, Hou L, Lohman K, Young T, Cui W, Huang Z, Grenier C, Wan M, Stunnenberg HG, Siscovick D, Hou L, et al. Blood monocyte transcriptome and epigenome analyses reveal loci associated with human atherosclerosis. Nat Commun. 2017; 8:393. https://doi.org/10.1038/s41467-017-00517-4 [PubMed]
- 10. Miao L, Yin RX, Pan SL, Yang S, Yang DZ, Lin WX. Circulating miR-3659 may be a potential biomarker of dyslipidemia in patients with obesity. J Transl Med. 2019; 17:25. https://doi.org/10.1186/s12967-019-1776-8 [PubMed]
- 11. Holvoet P, Klocke B, Vanhaverbeke M, Menten R, Sinnaeve P, Raitoharju E, Lehtimäki T, Oksala N, Zinser C, Janssens S, Sipido K, Lyytikainen LP, Cagnin S. RNA-sequencing reveals that STRN, ZNF484 and WNK1 add to the value of mitochondrial MT-COI and COX10 as markers of unstable coronary artery disease. PLoS One. 2019; 14:e0225621. https://doi.org/10.1371/journal.pone.0225621 [PubMed]
- 12. Park HJ, Noh JH, Eun JW, Koh YS, Seo SM, Park WS, Lee JY, Chang K, Seung KB, Kim PJ, Nam SW. Assessment and diagnostic relevance of novel serum biomarkers for early decision of ST-elevation myocardial infarction. Oncotarget. 2015; 6:12970–83. https://doi.org/10.18632/oncotarget.4001 [PubMed]
- 13. Maciejak A, Kiliszek M, Michalak M, Tulacz D, Opolski G, Matlak K, Dobrzycki S, Segiet A, Gora M, Burzynska B. Gene expression profiling reveals potential prognostic biomarkers associated with the progression of heart failure. Genome Med. 2015; 7:26. https://doi.org/10.1186/s13073-015-0149-z [PubMed]
- 14. Nührenberg TG, Langwieser N, Binder H, Kurz T, Stratz C, Kienzle RP, Trenk D, Zohlnhöfer-Momm D, Neumann FJ. Transcriptome analysis in patients with progressive coronary artery disease: identification of differential gene expression in peripheral blood. J Cardiovasc Transl Res. 2013; 6:81–93. https://doi.org/10.1007/s12265-012-9420-5 [PubMed]
- 15. Grayson BL, Wang L, Aune TM. Peripheral blood gene expression profiles in metabolic syndrome, coronary artery disease and type 2 diabetes. Genes Immun. 2011; 12:341–51. https://doi.org/10.1038/gene.2011.13 [PubMed]
- 16. Langfelder P, Horvath S. WGCNA: an R package for weighted correlation network analysis. BMC Bioinformatics. 2008; 9:559. https://doi.org/10.1186/1471-2105-9-559 [PubMed]
- 17. Yu G, Wang LG, Han Y, He QY. clusterProfiler: an R package for comparing biological themes among gene clusters. OMICS. 2012; 16:284–87. https://doi.org/10.1089/omi.2011.0118 [PubMed]
- 18. Szklarczyk D, Gable AL, Lyon D, Junge A, Wyder S, Huerta-Cepas J, Simonovic M, Doncheva NT, Morris JH, Bork P, Jensen LJ, Mering CV. STRING v11: protein-protein association networks with increased coverage, supporting functional discovery in genome-wide experimental datasets. Nucleic Acids Res. 2019; 47:D607–13. https://doi.org/10.1093/nar/gky1131 [PubMed]
- 19. Miao L, Yin RX, Huang F, Yang S, Chen WX, Wu JZ. Integrated analysis of gene expression changes associated with coronary artery disease. Lipids Health Dis. 2019; 18:92. https://doi.org/10.1186/s12944-019-1032-5 [PubMed]
- 20. Zhu Z, Jin Z, Deng Y, Wei L, Yuan X, Zhang M, Sun D. Co-expression network analysis identifies four hub genes associated with prognosis in soft tissue sarcoma. Front Genet. 2019; 10:37. https://doi.org/10.3389/fgene.2019.00037 [PubMed]
- 21. Zhuo LA, Wen YT, Wang Y, Liang ZF, Wu G, Nong MD, Miao L. LncRNA SNHG8 is identified as a key regulator of acute myocardial infarction by RNA-seq analysis. Lipids Health Dis. 2019; 18:201. https://doi.org/10.1186/s12944-019-1142-0 [PubMed]
- 22. Miao L, Yin RX, Yang S, Huang F, Chen WX, Cao XL. Association between single nucleotide polymorphism rs9534275 and the risk of coronary artery disease and ischemic stroke. Lipids Health Dis. 2017; 16:193. https://doi.org/10.1186/s12944-017-0584-5 [PubMed]
- 23. Miao L, Yin RX, Zhang QH, Hu XJ, Huang F, Chen WX, Cao XL, Wu JZ. A novel lncRNA-miRNA-mRNA triple network identifies lncRNA TWF1 as an important regulator of miRNA and gene expression in coronary artery disease. Nutr Metab (Lond). 2019; 16:39. https://doi.org/10.1186/s12986-019-0366-3 [PubMed]
- 24. Weber C, Noels H. Atherosclerosis: current pathogenesis and therapeutic options. Nat Med. 2011; 17:1410–22. https://doi.org/10.1038/nm.2538 [PubMed]
- 25. Geovanini GR, Libby P. Atherosclerosis and inflammation: overview and updates. Clin Sci (Lond). 2018; 132:1243–52. https://doi.org/10.1042/CS20180306 [PubMed]
- 26. Kyaw T, Winship A, Tay C, Kanellakis P, Hosseini H, Cao A, Li P, Tipping P, Bobik A, Toh BH. Cytotoxic and proinflammatory CD8+ T lymphocytes promote development of vulnerable atherosclerotic plaques in apoE-deficient mice. Circulation. 2013; 127:1028–39. https://doi.org/10.1161/CIRCULATIONAHA.112.001347 [PubMed]
- 27. Koltsova EK, Garcia Z, Chodaczek G, Landau M, McArdle S, Scott SR, von Vietinghoff S, Galkina E, Miller YI, Acton ST, Ley K. Dynamic T cell-APC interactions sustain chronic inflammation in atherosclerosis. J Clin Invest. 2012; 122:3114–26. https://doi.org/10.1172/JCI61758 [PubMed]
- 28. Wolf D, Ley K. Immunity and inflammation in atherosclerosis. Circ Res. 2019; 124:315–27. https://doi.org/10.1161/CIRCRESAHA.118.313591 [PubMed]
- 29. Centa M, Prokopec KE, Garimella MG, Habir K, Hofste L, Stark JM, Dahdah A, Tibbitt CA, Polyzos KA, Gisterå A, Johansson DK, Maeda NN, Hansson GK, et al. Acute loss of apolipoprotein E triggers an autoimmune response that accelerates atherosclerosis. Arterioscler Thromb Vasc Biol. 2018; 38:e145–58. https://doi.org/10.1161/ATVBAHA.118.310802 [PubMed]
- 30. Crotty S, Johnston RJ, Schoenberger SP. Effectors and memories: bcl-6 and blimp-1 in T and B lymphocyte differentiation. Nat Immunol. 2010; 11:114–20. https://doi.org/10.1038/ni.1837 [PubMed]
- 31. Ding R, Gao W, He Z, Wang H, Conrad CD, Dinney CM, Yuan X, Wu F, Ma L, Wu Z, Liang C. Overrepresentation of Th1- and Th17-like follicular helper T cells in coronary artery disease. J Cardiovasc Transl Res. 2015; 8:503–05. https://doi.org/10.1007/s12265-015-9662-0 [PubMed]
- 32. Ding R, Gao W, He Z, Wu F, Chu Y, Wu J, Ma L, Liang C. Circulating CD4+ CXCR5+ T cells contribute to proinflammatory responses in multiple ways in coronary artery disease. Int Immunopharmacol. 2017; 52:318–23. https://doi.org/10.1016/j.intimp.2017.09.028 [PubMed]
- 33. van der Vorst EP, Daissormont I, Aslani M, Seijkens T, Wijnands E, Lutgens E, Duchene J, Santovito D, Döring Y, Halvorsen B, Aukrust P, Weber C, Höpken UE, Biessen EA. Interruption of the CXCL13/CXCR5 chemokine axis enhances plasma IgM levels and attenuates atherosclerosis development. Thromb Haemost. 2020; 120:344–47. https://doi.org/10.1055/s-0039-3400746 [PubMed]
- 34. GTEx Consortium. Human genomics. The genotype-tissue expression (GTEx) pilot analysis: multitissue gene regulation in humans. Science. 2015; 348:648–60. https://doi.org/10.1126/science.1262110 [PubMed]
- 35. Canela-Xandri O, Rawlik K, Tenesa A. An atlas of genetic associations in UK biobank. Nat Genet. 2018; 50:1593–99. https://doi.org/10.1038/s41588-018-0248-z [PubMed]