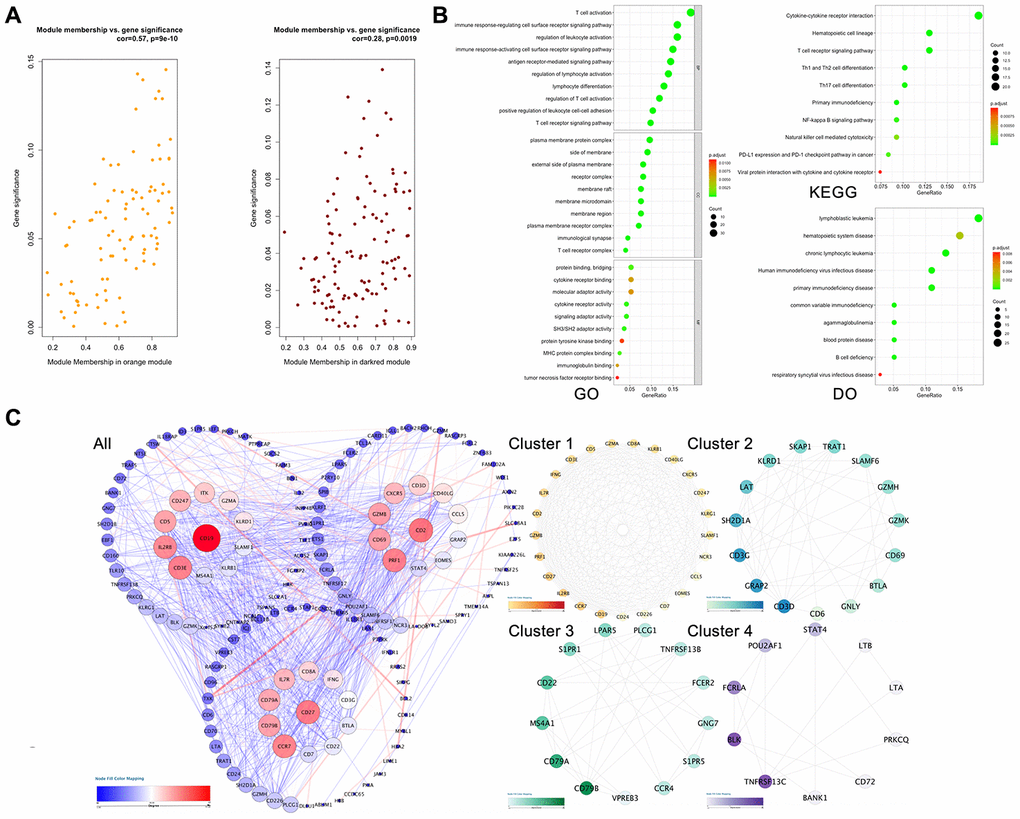
Figure 3.Hub gene screening process. (A) Association with gene significance and modules. The correlation between the module traits and the significance of gene expression. The higher the correlation, the higher the correlation between the gene expression in the module and the module trait. (B) Function annotation: (GO) Gene Ontology; (KEGG) Kyoto Encyclopedia of Genes and Genomes pathway enrichment; (DO) Disease Ontology; (C) Protein-protein interaction network of the selected genes. Edge stands for the interaction between two genes. A degree was used for describing the importance of protein nodes in the network, red shows a high degree and blue presents a low degree. The depth of the color represents the degree of correlation, and the deeper the color, the higher the correlation. The significant modules identified from the PPI using the molecular complex detection method with a score of >6.0. All: all of the genes; Cluster 1: MCODE-1= 12.07; Cluster 2: MCODE-2 = 9.92; Cluster 3: MOCDE-3 = 7.39; Cluster 4: MCODE-4 = 6.28.