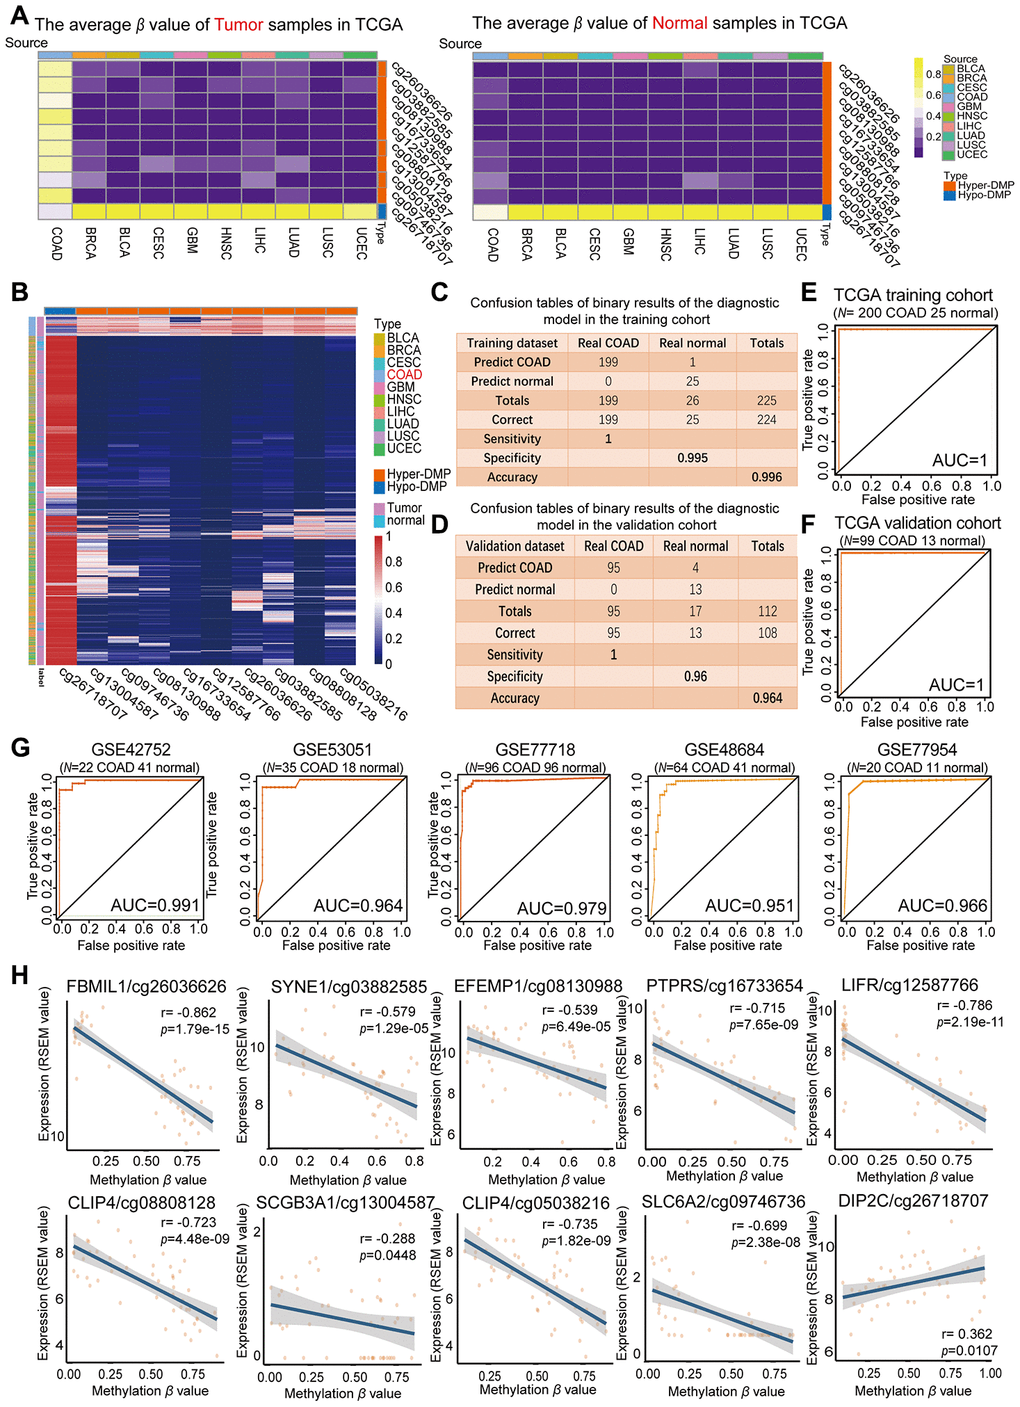
Figure 3.Evaluation of the COAD-specific diagnostic biomarkers and diagnostic model. (A) Heat maps of the average methylation levels of the nine Hyper-DMPs and one Hypo-DMP in all the samples from 10 cancer types. The legend on the right marks the source and CpG type. The picture on the left represents the tumor samples in TCGA, while the picture on the right represents the normal samples in TCGA. (B) Unsupervised hierarchical clustering of the methylation levels of the nine Hyper-DMPs and one Hypo-DMP in all the samples from 10 cancer types. The legend on the right marks the source and CpG type. (C–F) Confusion tables (C, E) and corresponding ROC curves (D, F) for the binary results of the COAD-specific diagnostic model in the training cohort (N = 225) and the validation cohort (N = 112) from TCGA. (G) ROC curves of the COAD-specific diagnostic model in five GEO COAD validation cohorts (GSE42752, GSE53051, GSE77718, GSE48684 and GSE77954, which included 22 COAD and 41 normal samples, 35 COAD and 18 normal samples, 96 paired COAD and normal samples, 64 COAD and 41 normal samples, and 20 COAD and 11 normal samples, respectively). (H) The correlation between the DMP methylation level and the expression of the corresponding gene for each diagnostic biomarker, determined through Pearson correlation tests (r > 0.2, FDR < 0.05). Gene expression is presented as the RSEM normalized count converted by log2 (x + 1).