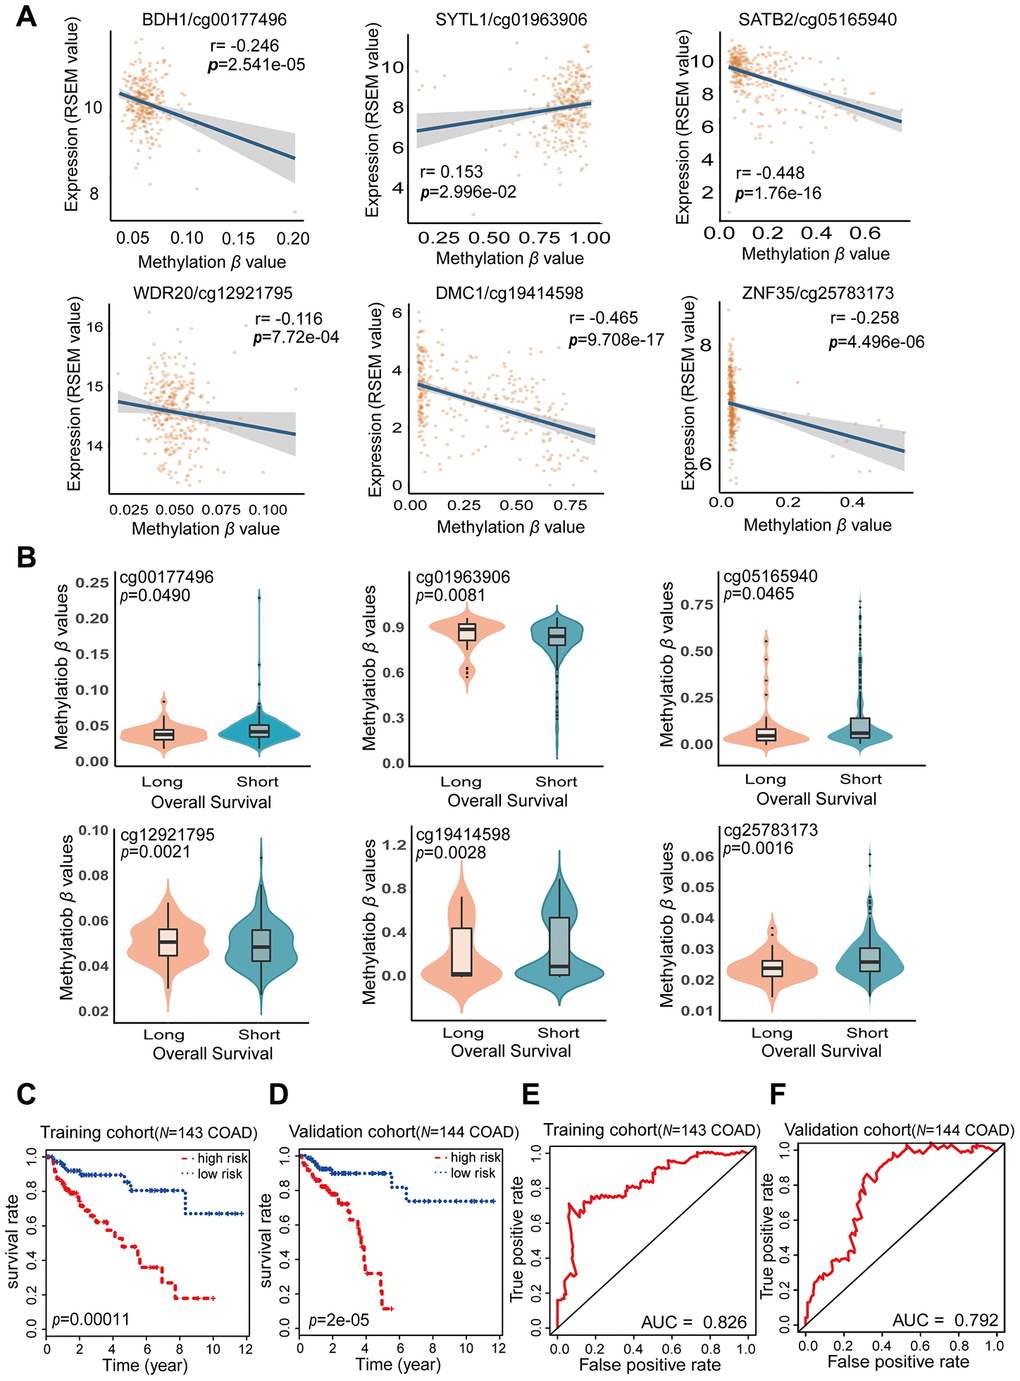
Figure 5.Characteristics of the potential prognostic biomarkers and evaluation of the combined prognostic model based on six CpG sites. (A) The correlations between the methylation β levels of the prognostic biomarkers and the expression of the corresponding genes were evaluated with Pearson correlation tests. Gene expression is presented as the RSEM normalized count converted by log2 (x + 1). (B) Violin plots of the methylation β values for patients with longer (> 5 years) and shorter (< 5 years) OS in the training cohort, with the median in the centerline. A Wilcoxon test was used to determine the difference between the two groups. The corresponding CpG sites, cor-values and p-values are shown at the top of the plot. (C, D) Kaplan-Meier analysis was performed on the OS of high-risk and low-risk patients using our prognostic model in the training (N = 143) (C) and validation (N = 144) (D) cohorts from TCGA. The difference in OS between the two groups was determined with a log-rank test. Higher risk scores were associated with significantly poorer OS. Patients were divided into low-risk and high-risk groups using the median risk score as the cut-off. (E, F) ROC curves showing the sensitivity and specificity of the prognostic model in predicting patients’ OS in the training (N = 143) (E) and validation (N = 144) (F) cohorts from TCGA.