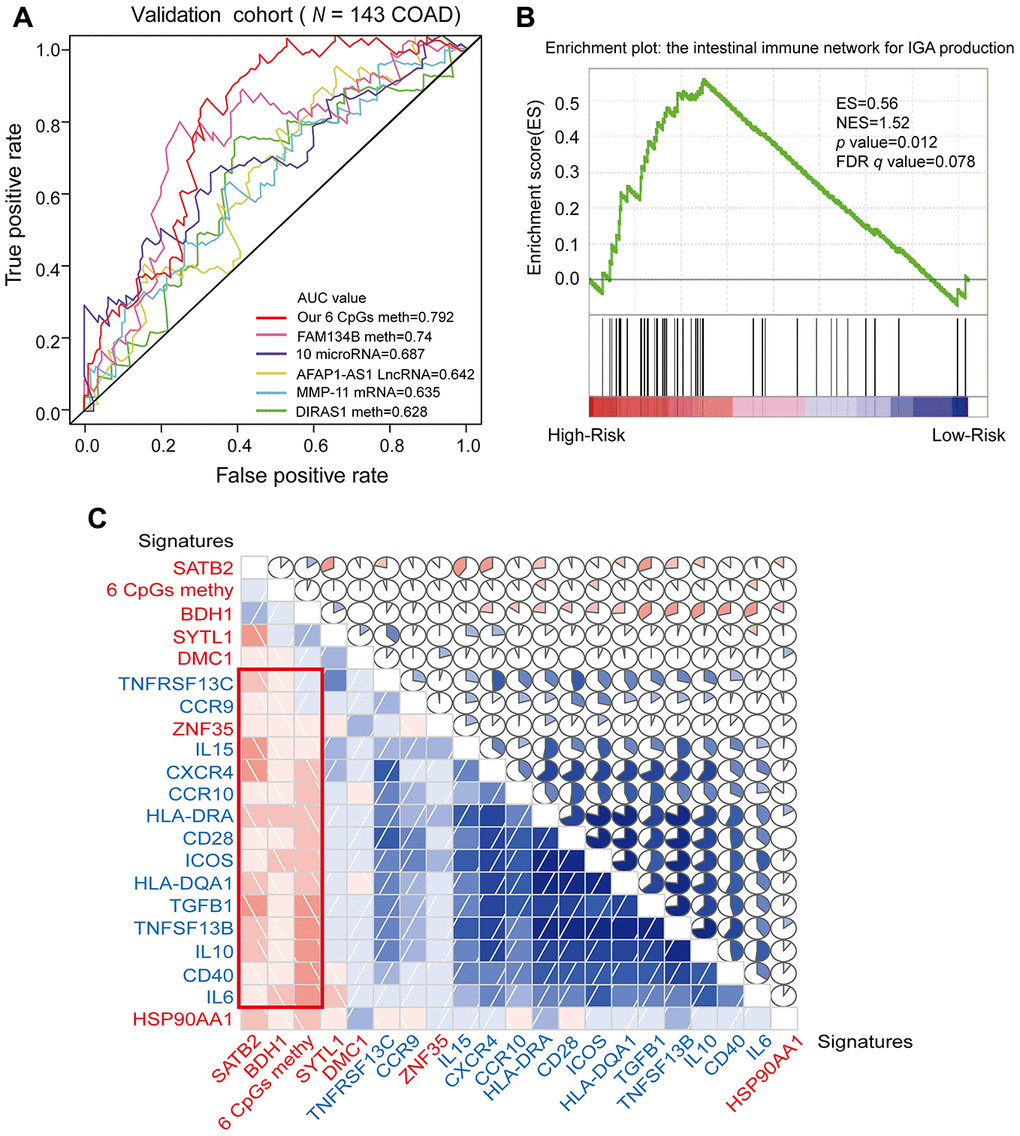
Figure 8.ROC analysis of different prognostic biomarkers and functional enrichment analysis of the corresponding genes. (A) ROC curve showing the sensitivity and specificity of our prognostic model and other known models in predicting the OS of patients in the validation cohort from TCGA. (B) COAD samples were divided into high-risk and low-risk groups, and the enrichment of IINIP pathway gene expression was analyzed using GSEA. ES, concentration fraction; NES, standardized ES; p-value, normalized p-value; FDR q-value, p-value corrected by the FDR method. (C) Correlation of the expression of the core enrichment genes from the IINIP pathway, the combined methylation level of our prognostic model and the expression of the genes corresponding to the individual CpG sites of the COAD prognostic biomarkers. The red signature represents the expression of the genes corresponding to the six CpG sites and the six-site combined methylation value; the blue signature represents the expression of the core enrichment genes in the IINIP pathway. Lower triangle: grids showing the correlation between two signatures, where blue indicates a positive correlation and red indicates a negative correlation. Upper triangle: circles represent the one-to-one correlation coefficients, differentiated by the fill area and intensity of shading. Blue indicates a positive correlation and red indicates a negative correlation.