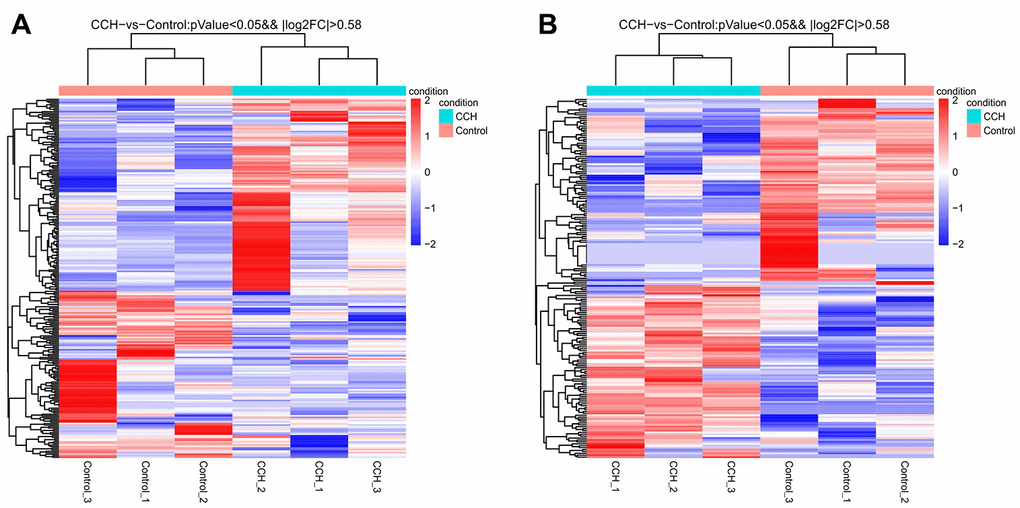
Figure 3.Heatmap of all differentially expressed mRNA (A) and lncRNA (B) in hippocampal tissues after chronic cerebral hypoperfusion. Each row represents one miRNA or lncRNA, and each column represents one hippocampal sample. Relative mRNA or lncRNA level is showed by the color scale. Red and blue colors respectively represent high and low relative expression level. The fold changes were normalized and scaled from-2.0 to 2.0 by Z-score.