


Introduction
Chronic cerebral hypoperfusion (CCH) exists in many neurodegenerative diseases, such as Alzheimer’s disease [1], vascular dementia [2], and Parkinson’s disease [3], and it functions in the development of these diseases. CCH causes brain tissue to be in a state of hypoperfusion, resulting in ischemia and hypoxia of neural tissue cells, preventing an effective supply of nutrients. Neuronal cells, including neurons and various glial cells in the brain, show oxidative stress [4], calcium overload [5], mitochondrial damage [6], neurotransmitter synthesis dysfunction [7], blood-brain barrier disruption [8], demyelination of nerve fibers [9], and white matter lesions [10]. Furthermore, a variety of signaling pathways are activated in the cell, such as the energy-sensing molecular pathway [11], glucose metabolism pathway [12], kinase pathway [13], cell anabolic [14], apoptotic pathways [15], and so on. These signaling pathways and mechanisms work together in brain cells after CCH, and cause a series of changes in cell function and morphology and aggravation of neurodegeneration based on the existing gene expression changes in neurodegenerative diseases. However, the network relationship between various molecular and pathway changes in the brain tissue after CCH is very complicated, and has not been thoroughly analyzed so far. Therefore, a lack of comprehensive and in-depth understanding of the overall neurological changes caused by CCH remains.
The mammalian genome contains 20,000 protein-coding genes, which represent less than 5% of the genome, and 85% of the genome can be transcribed into RNA, so most of the genome is occupied by non-coding genes [16]. Based on the length of the nucleotides, non-coding RNAs (ncRNAs) of ≥200 nucleotides in length are classified as long ncRNAs (lncRNAs) and those of <200 nucleotides in length are classified as short ncRNAs. LncRNAs are distributed in the nucleus and cytoplasm, as well as in some exosomes and mitochondria [17]. Due to the wide distribution of lncRNAs, their functions are also diverse. Since the introduction of RNA sequencing technology, more and more lncRNAs in different abundances have been identified [18]. This has laid a solid foundation for a comprehensive understanding of the regulatory functions of lncRNA in cells. According to genomic location and structure, lncRNAs can be divided into intergenic lncRNAs away from neighboring genes, anti-sense lncRNAs with sequence elements pairing to other RNAs, sense lncRNAs located within other genes, intronic lncRNAs generated from the introns of other genes, and bi-directional lncRNAs. Among these, intergenic and anti-sense lncRNAs are by far the most common lncRNAs types in mammals [19]. The classifications of lncRNAs can reflect their functions. Anti-sense lncRNAs can bind and regulate their anti-sense genes transcription and act in cis. Trans-acting lncRNAs can also be transported to other locations in the cell to regulate the transcription of genes by acting as scaffolds or decoys to recruit the transcriptional factors, as signaling guides and enhancers of the regulation of mRNA transcription, and by regulating post-transcriptional mRNA levels by sponging miRNAs from binding mRNA to avoid degradation [19–21]. However, the function of many other lncRNAs remains elusive.
Due to the potentially complex and diverse functions of lncRNA, cells contain intricate regulatory networks between lncRNA and mRNA. The lncRNA-regulating network is very susceptible to changes when cells are affected by the external environment, and it is conceivable that they can participate in the regulation of cell functions. LncRNA GAS5 can bind to the PFKFB3 promoter to promote PFKFB3 expression to foster neuronal glycolysis, and this aggravates cerebral ischemia/reperfusion injury [22]. Blocking the binding between lncRNA H19 and miR-19a can improve hypoxia/ischemia-induced neuronal injury [23]. LncRNA-1810034E14Rik has been reported to reduce the expression of inflammatory cytokines and microglia activation in ischemic stroke mice [24]. Previous studies have also shown that many changes in lncRNA expression occur after CCH [25]. After CCH, it remains unclear whether the lncRNA-regulating network in the hippocampus changes, and how it changes. Presently, studies use RNA sequencing technology combined with bioinformatics methods to predict and construct the lncRNA-regulating network of hippocampal tissue after CCH. This facilitates exploration and analysis of the function of lncRNA in cognitive impairment after CCH, and the possible molecular pathways. The analysis of lncRNA-regulating networks is helpful for understanding the key mechanism of the development of cognitive dysfunction and providing a theoretical basis for effective therapeutic targets for CCH.
Results
CCH-induced dysfunction of spatial learning and memory in the Morris water maze test
The results of the Morris water maze test showed that CCH rats had a much longer latency time to reach the platform from the third to seventh training day than the sham control rats (P < 0.01) (Figure 1A). CCH rats spent noticeably less time in the platform area from the fourth to seventh training day than the sham control rats (P < 0.01) (Figure 1B). After 7 days of training and 1 day of rest, the short-term memory test showed that the CCH rats had a dramatically longer latency time to reach the platform than sham rats (P < 0.01) (Figure 1C). After removing the platform, CCH rats spent less time in the platform area and less crossing time around the platform area than the sham control rats (P < 0.01) (Figure 1D–1E).
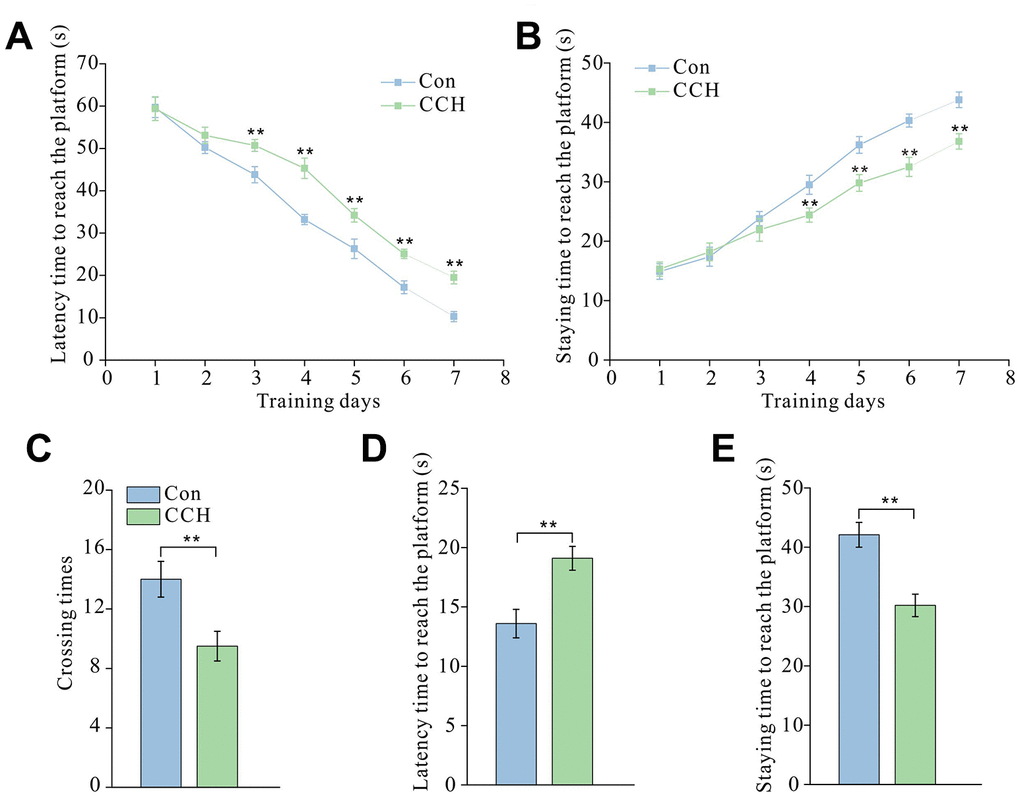
Figure 1. Chronic cerebral hypoperfusion induced spatial learning and memory impairment in the Morris water maze test. After a 30-day cerebral hypoperfusion, the rats were trained to learn and remember the location of the platform in the Morris water maze. The latency time to find the platform (A) and the staying time in the platform area (B) from the first to the seventh day were recorded to evaluate the learning ability of rats. After 1-day rest, the rats were re-tested and the number of times the platform area was crossed (C), the latency time to find the platform (D), and the time staying in the platform quadrant (E) were recorded to evaluate short-term memory. Con: sham group (n=15); CCH: the group with bilateral common carotid artery ligation (n=20). Data are expressed as mean ± SEM. ** P<0.01, compared with the Con group.
No obvious number changes of neurons in hippocampus and striatum after chronic cerebral hypoperfusion
In order to explore the potential causes of spatial cognitive dysfunction caused by chronic cerebral hypoperfusion, brain sections were stained by HE staining and the changes of morphology and number of neurons in the sections were observed. The results showed that there was no significant change in the number of neurons in CA3, CA1, DG and striatum (Figure 2A, 2B). This suggested that the cognitive dysfunction caused by chronic cerebral hypoperfusion may not be due to the neurons decrease of in hippocampus and striatum. Scale bar=50μm.
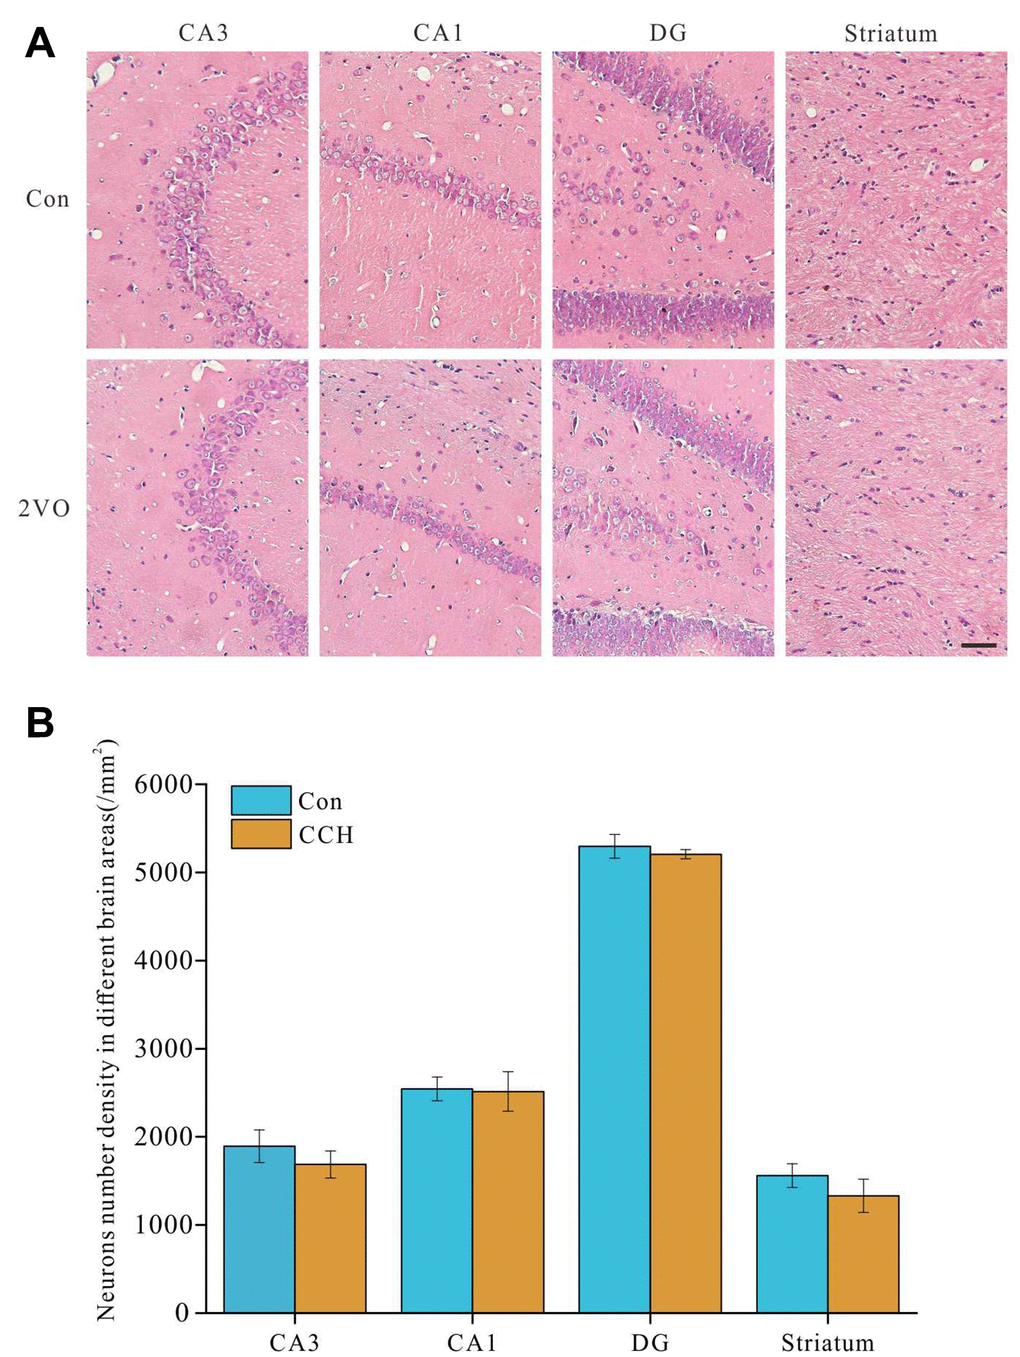
Figure 2. No obvious number changes of neurons in hippocampus and striatum after chronic cerebral hypoperfusion. The brain slides were stained with HE staining. (A) the images of CA1, CA3, DG of hippocampus and striatum, (B) the analysis of the number of neurons in hippocampus and striatum.
Expression profile of lncRNA and mRNA profiles in the CCH rat hippocampus
To investigate the underlying mechanisms of cognitive deficit caused by chronic cerebral hypoperfusion, we employed the RNA sequencing to explore the mRNA and lncRNA changes of hippocampus closely related with cognition after chronic cerebral hypoperfusion. Through the assessment of total RNA quantity (≥13μg), the sample concentration (≥433μg/μL), the purity of samples(OD260/280 ≥1.82) and the sample integrity(RIN≥8.5), all extracted RNAs from hippocampus tissue completely meet the requirement of library construct. After high throughput RNA sequencing, 654.12M raw reads and 98.11G raw bases were acquired, containing 340.81M reads and 51.12G for CCH models, and 315.31M reads and 46.99G for the sham controls. Through low quality sequencing data cleaning of the original data, we finally obtained 632.98 M clean reads and 89.54G clean bases in total, containing 329.81M reads and 46.64G bases in the CCH models, and 303.17M reads and 42.9 bases in the sham controls. The proportions of valid bases were 90.75%-91.69% and the Q30s were 94.19~94.68%. The average guanine-cytosine (GC) content was 48.07%.
A total of 22601 protein-encoding transcripts and 15460 lncRNAs were identified and subsequently analyzed in-depth. For lncRNA, 1371 novel lncRNAs were identified and subsequently analyzed. These have not been reported in the past. The sequence length of lncRNA transcripts ranged from 200–4300 bp. A total of 236 mRNAs and 189 lncRNAs were significantly altered in the CCH rat hippocampus compared to sham controls. Among these, 128 mRNAs and 91 lncRNAs were up-regulated, while 108 mRNAs and 98 lncRNAs were down-regulated.
The most up-regulated mRNAs and lncRNAs were Sftpa1 and TCONS_00019175, with FCs of 79.54 and 689.55, respectively compared to sham controls. The most down-regulated mRNAs and lncRNAs were Cdh17 and ENSRNOT00000092488, with FCs of 13.38 and 182.18, respectively compared to sham controls. The top 20 up-regulated and 20 down-regulated lncRNAs and mRNAs in the CCH group are listed in Tables 1 and 2. The clustering analysis and volcano plot visualization showed dramatically different expression levels of mRNAs and lncRNAs in the CCH and sham groups (Figures 3 and 4).
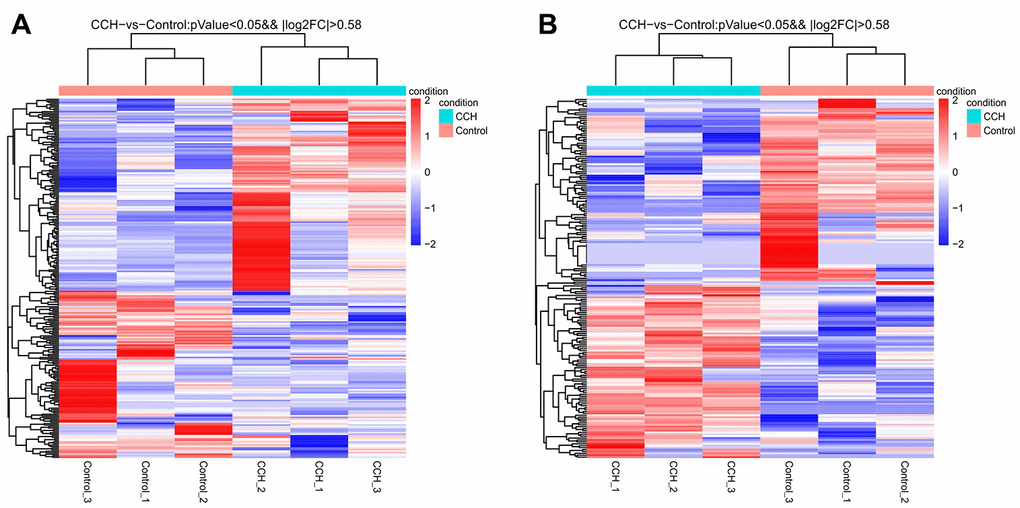
Figure 3. Heatmap of all differentially expressed mRNA (A) and lncRNA (B) in hippocampal tissues after chronic cerebral hypoperfusion. Each row represents one miRNA or lncRNA, and each column represents one hippocampal sample. Relative mRNA or lncRNA level is showed by the color scale. Red and blue colors respectively represent high and low relative expression level. The fold changes were normalized and scaled from-2.0 to 2.0 by Z-score.
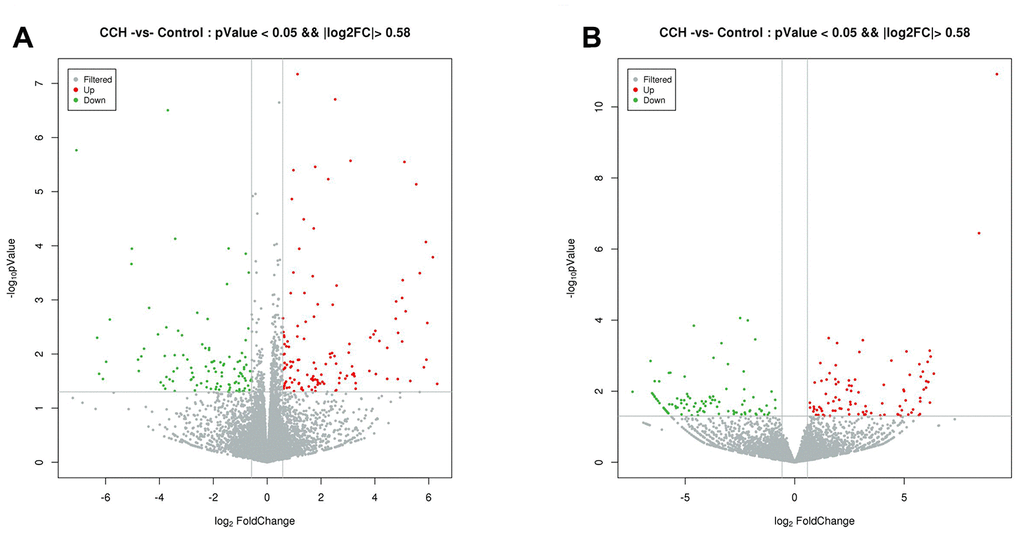
Figure 4. Volcano plot of differentially expressed mRNAs (A) and lncRNAs (B). Normalized fold change and P values (CCH group/sham group) were used to construct the volcano plots. The horizontal and vertical lines represents P value and fold change, respectively. The red and green dots represent statistically significantly upregulated and downregulated mRNAs and lncRNAs. The gray dots represent no statistically significantly altered mRNAs and lncRNAs.
Table 1. Top 40 differently expressed mRNAs determined by sequencing analysis.
| SeqID | P-value | Fold change | Log2FC | Regulation | Location |
| Sftpa1 | 0.035649498 | 79.54236679 | 6.313651585 | Up | Chr16:18716019-18719404 |
| Tmem72 | 0.000162756 | 71.14848534 | 6.152761139 | Up | Chr4:148819906-148845199 |
| Sftpc | 0.002670317 | 61.68503716 | 5.946848674 | Up | Chr15:52211538-52214480 |
| Adipoq | 0.012731588 | 60.29333722 | 5.913926679 | Up | Chr11:81330845-81344488 |
| Cldn2 | 8.53E-05 | 59.48058263 | 5.894346874 | Up | ChrX:111122552-111133188 |
| Tmem27 | 0.017575581 | 56.48254167 | 5.819733105 | Up | ChrX:32118082-32153687 |
| Sostdc1 | 0.000320698 | 50.87297918 | 5.668827678 | Up | Chr6:55812820-55816994 |
| LOC100912642 | 7.31E-06 | 46.41535627 | 5.536530287 | Up | Chr5:115021650-115066897 |
| Hnf4a | 0.03147996 | 39.83567939 | 5.315989275 | Up | Chr3:159902441-159965003 |
| Kcnj13 | 0.001624843 | 35.32490895 | 5.142613937 | Up | Chr9:94486719-94495333 |
| LOC108348080 | 2.83E-06 | 34.25942751 | 5.098429138 | Up | Chr5:137670134-137674730 |
| Fam111a | 0.000432214 | 32.77758573 | 5.03463769 | Up | Chr1:229003778-229019532 |
| Zscan10 | 0.005874147 | 32.28482174 | 5.012784156 | Up | Chr10:12929471-12939439 |
| Mfrp | 0.00092184 | 32.25845168 | 5.01160529 | Up | Chr8:48437720-48443421 |
| Ttr | 0.00406495 | 29.07587954 | 4.861750929 | Up | Chr8:48437720-48443421 |
| Sftpd | 0.028999273 | 28.83912105 | 4.84995529 | Up | Chr16:18753535-18766100 |
| Kl | 0.001069084 | 27.64599709 | 4.7889987 | Up | Chr12:942974-987206 |
| Slco1a5 | 0.002227845 | 27.37727008 | 4.774906691 | Up | Chr4:176445856-176528117 |
| Pon1 | 0.007692375 | 22.00198066 | 4.459561498 | Up | Chr4:30249749-30276297 |
| Tbx22 | 0.02878544 | 21.9812802 | 4.458203507 | Up | Chr6:78731738-78782542 |
| Cdh17 | 0.026567758 | 0.074755887 | -3.741668988 | Down | Chr5:24595130-24647265 |
| Tsks | 0.003213479 | 0.074640041 | -3.743906412 | Down | Chr1:89687761-89704629 |
| LOC100911867 | 0.043812182 | 0.072443709 | -3.786995785 | Down | Chr3:4726787-4777044 |
| LOC103690085 | 0.010844504 | 0.071646249 | -3.802965019 | Down | Chr14:81896533-81910812 |
| Adad2 | 0.038213527 | 0.069265151 | -3.851726507 | Down | Chr19: 46924046-46927731 |
| LOC103692396 | 0.033343448 | 0.06448369 | -3.954921897 | Down | Chr5:96118893-96121269 |
| Slc5a8 | 0.004340917 | 0.060175138 | -4.054688634 | Down | Chr7: 20424418-20472528 |
| LOC103689983 | 0.001406324 | 0.047911885 | -4.383472628 | Down | ChrX: 158620026-158658482 |
| Lilrb3l | 0.007988447 | 0.042010311 | -4.573112727 | Down | Chr1:63074136-63156261 |
| Tspan4 | 0.011055516 | 0.039204835 | -4.672824615 | Down | Chr1:194203708-194227265 |
| Cxcl9 | 0.020607605 | 0.036732847 | -4.76678546 | Down | Chr11:15116823-15122702 |
| Rs1 | 0.012726917 | 0.036012269 | -4.79536769 | Down | ChrX:34647947-34682011 |
| LOC100910575 | 0.000113293 | 0.030713747 | -5.024971648 | Down | Chr4:173113940-173126275 |
| LOC100912599 | 0.000217208 | 0.030408465 | -5.039383217 | Down | Chr1:31263887-31274006 |
| Adam2 | 0.002304837 | 0.017410406 | -5.843906346 | Down | Chr15:39910586-39959136 |
| Gulo | 0.013924598 | 0.01583012 | -5.981183981 | Down | Chr15:39875033-39901896 |
| Ccr9 | 0.028961397 | 0.014583031 | -6.099565609 | Down | Chr8:122502967-122519814 |
| Rax | 0.023198491 | 0.013213792 | -6.241811661 | Down | Chr18:57585248-57589682 |
| Krt15 | 0.005008875 | 0.012574843 | -6.313315842 | Down | Chr10:83785803-83790384 |
| Klkb1 | 1.72E-06 | 0.00736717 | -7.084673798 | Down | Chr16:44946907-44974897 |
Table 2. Top 40 differently expressed lncRNAs determined by sequencing analysis.
| SeqID | P-value | Fold change | Log2FC | Regulation | Location | Strand |
| TCONS_00019175 | 2.12E-05 | 689.5463744 | 9.429503771 | up | Chr20:8484402-8486647 | + |
| XR_001841711.1 | 0.005003081 | 43.69311729 | 5.449334134 | up | Chr16:23558712-23573465 | + |
| XR_352416.3 | 0.008353892 | 33.90818162 | 5.083561514 | up | Chr3:66403184-66437012 | - |
| XR_592335.2 | 0.000489082 | 20.57844907 | 4.36306235 | up | Chr4:173432829-173449403 | - |
| ENSRNOT00000088984 | 0.020448703 | 15.91505066 | 3.992319844 | up | Chr5:114204472-114338491 | - |
| TCONS_00034350 | 0.018563841 | 15.32730546 | 3.938032188 | up | ChrX:77357719-77428433 | + |
| XR_001840711.1 | 0.043787387 | 10.77804191 | 3.430023196 | up | Chr12:47533276-47551299 | - |
| XR_001836753.1 | 0.028424077 | 9.493702429 | 3.246970831 | up | Chr2:157099856-157115301 | + |
| ENSRNOT00000082797 | 0.048125901 | 9.080827736 | 3.182823808 | up | Chr17:51948845-51981020 | + |
| TCONS_00004253 | 0.045912724 | 9.046206998 | 3.177313009 | up | Chr1:279203035-279273961 | - |
| XR_597041.2 | 0.037152064 | 7.718909279 | 2.948397002 | up | Chr18:65731592-65738010 | + |
| TCONS_00030722 | 0.010640434 | 7.523148724 | 2.911336611 | up | Chr8:4140617-4245359 | + |
| XR_592129.1 | 0.032146148 | 7.348211953 | 2.87739324 | up | Chr4:84793194-84793975 | + |
| TCONS_00013454 | 0.022839865 | 6.786643837 | 2.762698302 | up | Chr16:56827038-56827916 | - |
| TCONS_00004252 | 4.76E-05 | 6.367618035 | 2.670753798 | up | Chr1:279203035-279273882 | - |
| XR_591644.2 | 0.008110823 | 6.062764341 | 2.599975746 | up | Chr3:114310470-114336292 | + |
| XR_360324.3 | 0.035532206 | 5.962288925 | 2.575866288 | up | Chr16:8466963-8469867 | + |
| XR_001835788.1 | 0.002961999 | 5.595768535 | 2.484336288 | up | Chr1:120919146-120955987 | - |
| ENSRNOT00000092197 | 0.009893472 | 5.593120976 | 2.483653535 | up | Chr9:47965251-47970908 | + |
| XR_362349.3 | 0.036902812 | 5.442656945 | 2.444311105 | up | ChrX:10450197-10458126 | + |
| ENSRNOT00000092488 | 0.003679888 | 0.005488992 | -7.509242923 | down | Chr4:75593043-75708915 | + |
| XR_001838134.1 | 0.009844005 | 0.018397383 | -5.76435566 | down | Chr5:173138920-173141564 | + |
| XR_001841379.1 | 0.00675928 | 0.030261756 | -5.046360501 | down | Chr15:57879139-57883329 | - |
| XR_001836258.1 | 0.043519547 | 0.040314994 | -4.632539692 | down | Chr1:56023467-56038201 | + |
| XR_001839258.1 | 0.037684229 | 0.073426768 | -3.76755009 | down | Chr8:13878950-13896087 | + |
| TCONS_00013871 | 0.025346422 | 0.075680135 | -3.723941537 | down | Chr17:27509254-27521981 | + |
| XR_353865.3 | 0.002000053 | 0.07577333 | -3.72216604 | down | Chr5:21705806-21716612 | + |
| ENSRNOT00000077084 | 0.014798712 | 0.08214642 | -3.605658491 | down | Chr7:142860559-142861925 | - |
| XR_001836260.1 | 0.029438614 | 0.090860932 | -3.460196088 | down | Chr1:56023468-56038201 | + |
| XR_001836263.1 | 0.012980699 | 0.09182131 | -3.44502718 | down | Chr1:56023467-56038201 | + |
| XR_001840969.1 | 0.001400121 | 0.09739795 | -3.359964789 | down | Chr13:109908788-109955148 | + |
| XR_001836996.1 | 0.000246091 | 0.121155025 | -3.045073857 | down | Chr2:262810481-262873478 | - |
| XR_001835966.1 | 0.008604154 | 0.142374068 | -2.812241699 | down | Chr1:194072468-194078064 | - |
| TCONS_00026111 | 0.013013726 | 0.143542523 | -2.800449913 | down | Chr5:129088651-129297455 | - |
| XR_001838453.1 | 0.038538215 | 0.148548241 | -2.750996569 | down | Chr6:92760107-92773394 | + |
| XR_590384.2 | 0.000136273 | 0.177859013 | -2.491194014 | down | Chr1:157561774-157573264 | - |
| XR_597173.2 | 0.035083573 | 0.189302667 | -2.401233357 | down | Chr19:22220940-22244737 | + |
| XR_001842379.1 | 0.000279854 | 0.19964672 | -2.324478724 | down | Chr19:26267879-26269062 | + |
| ENSRNOT00000089868 | 0.005257745 | 0.202684724 | -2.302690734 | down | Chr19:36242337-36257062 | - |
| XR_352417.3 | 0.049679474 | 0.206762346 | -2.273954618 | down | Chr3:66403184-66417915 | - |
Expression profile validation
In order to verify the validity of RNA sequencing, we randomly selected two differentially up-regulated mRNAs of Katnal1 and Trpv4 and down-regulated mRNAs of Mgam and Cpg1 and two differentially up-regulated lncRNAs of XR_362089.3 and TCONS_00007808 and down-regulated lncRNAs of XR_001838876.1 and XR_595897.2 for detection by qRT-PCR. The qRT-PCR results showed that the change trends of the selected mRNA and lncRNA levels determined by qRT-PCR were consistent with these by RNA sequencing. This showed that the RNA sequencing data was valid (Figure 5A). The levels of Katnal1 and Trpv4 in hippocampus of CCH group were significantly up-regulated than in that of sham group (P<0.01), whereas Mgam and Cpg1 in hippocampus of CCH group were significantly down-regulated than in that of sham group (P<0.01) (Figure 5B). Similarly, up-regulation lncRNAs of XR_362089.3 and TCONS_00007808 and down-regulation lncRNAs of XR_001838876.1 and XR_595897.2 were noticeable in CCH group than in sham group (P<0.01) (Figure 5B). The primers used in qRT-PCR are listed in Table 3.
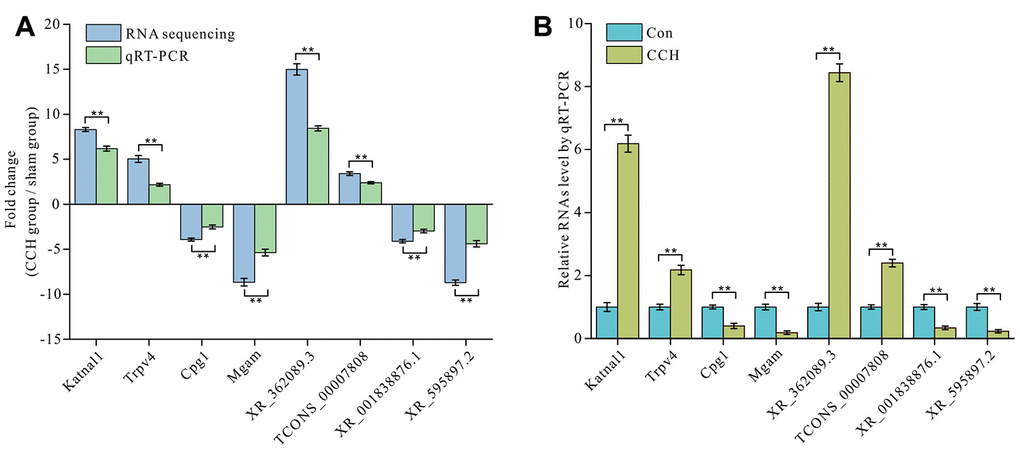
Figure 5. Validation of mRNA and lncRNA expression level by qRT-PCR. Two upregulated and two downregulated mRNAs and lncRNA expressions were determined by RNA seguencing and qRT-PCR (A) and the detailed validation by qRT-PCR was showed (B). The There are three parallel samples to be assayed (n=3). **, P<0.01.
Table 3. Primers designed for qRT-PCR validation of lncRNAs and mRNAs.
| RNAs | Forward primer | Reverse Primer | Product length (bp) |
| Katnal1 | 5' TGTTGTTTGAAATGGCGAGGTT 3' | 5' TCCGTCCATCTGGATGAGGA 3' | 143 |
| Trpv4 | 5' CAAGTGGCGTAAGTTCGG 3' | 5' TGCCCTCCAGTGGCTGAT 3' | 107 |
| Cpg1 | 5' TCTCCCAGTGTCGTCGTG 3' | 5' TCTTGCCTTTGCGTACA 3' | 89 |
| Mgam | 5' GCAAGGAGGAAGCGAAAG 3' | 5' AGTCCCGTCTCATAGTCA 3' | 61 |
| XR_362089.3 | 5' TGCTGCGACCCTTTGATA 3' | 5' AACCTCTAGCGCCGTAT 3' | 137 |
| TCONS_00007808 | 5' CAACCCACTCCAGTCGTCT 3' | 5' CAAATCCCAAGGGTCTCCGTTCA 3' | 132 |
| XR_001838876.1 | 5' CTTGAAGGCTGAGGCAGGAGGTT 3' | 5' AGGTAGGGTGAGGTAGAATGA 3' | 96 |
| XR_595897.2 | 5' CGAAGCCGTCACAGTGTCTCC 3' | 5' TTCAGTCACTCCTGTCATAGCG 3' | 132 |
GO function and KEGG pathway enrichment analyses of DE mRNAs
The GO analysis predicted, and the KEGG analysis showed, that DE RNAs were associated with the probable functions and pathways. GO analysis indicated that the most enriched mRNAs related to monocarboxylic acid transport (GO: 0015718) in biological processes (Figure 6A), the extracellular space (GO: 0005615) in the cellular component (Figure 6B), and the peptide antigen binding (GO: 0042605) in the molecular functions (Figure 6C). KEGG pathway analysis showed that the top 10 deferentially-enriched KEGG pathways related to dysregulated mRNAs were involved in tryptophan metabolism, graft-versus-host disease, allograft rejection, thyroid hormone synthesis, type I diabetes mellitus, autoimmune thyroid disease, the intestinal immune network for IgA production, staphylococcus aureus infection, cell adhesion molecules (CAMs), and viral myocarditis (Figure 6D).
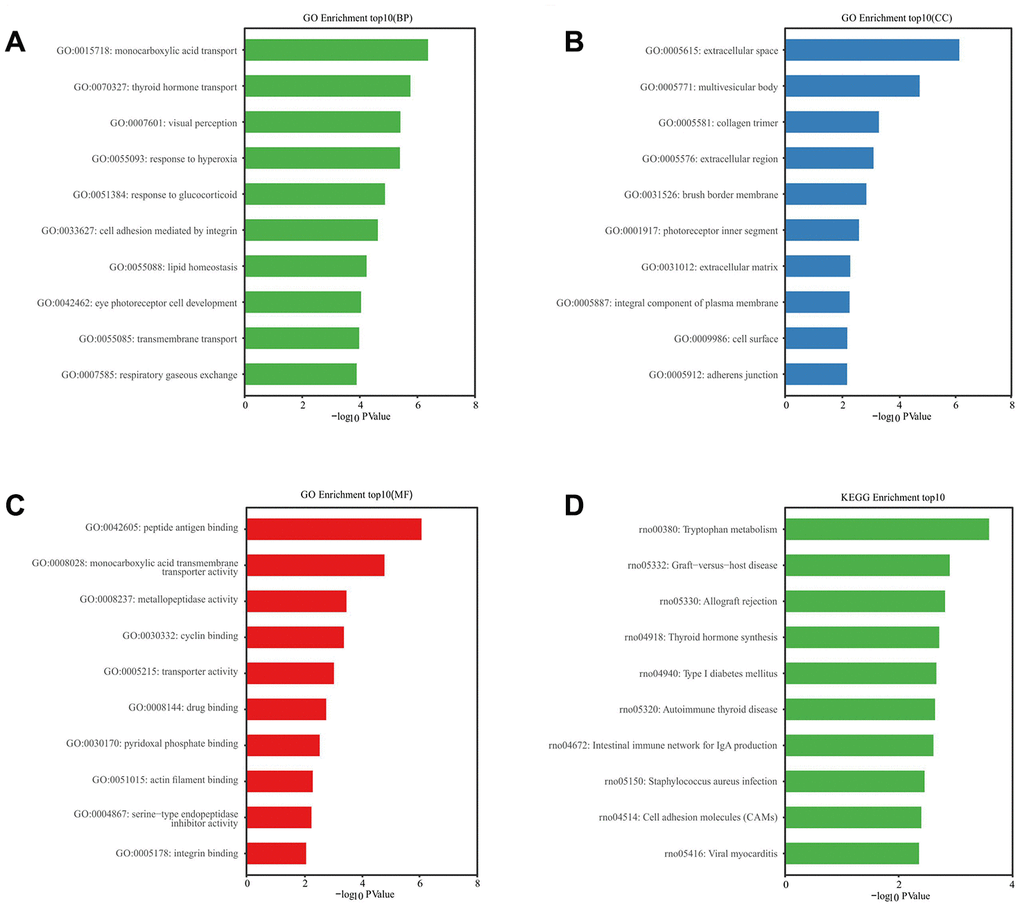
Figure 6. GO and KEGG pathway enrichment analysis of differentially expressed mRNAs. P value <0.05 was as significantly differentially enrichment. Enrichment value (-log10 (P value)) was calculated and visualized to show the enrichment of biological processes (A) the enrichment of cellular components (B) the enrichment of molecular functions (C) and the enrichment of the KEGG functional pathways (D).
LncRNA-mRNA co-expression analyses
In total, 161 DE lncRNAs that were correlated with DE mRNAs were identified (P < 0.05 and correlation coefficient (COR) > 0.8). Among of all the lncRNA-mRNA coexpressions, lncRNA XR_589889.2 and Tgm2 showed p = 0.0083 and COR = 0.92 and lncRNA XR_595556.2 and Cdhr3 showed P= 0.018 and COR = 0.89. Ten mRNAs and their coexpressed lncRNAs were selected to construct the expression network (Figure 7A–7C).
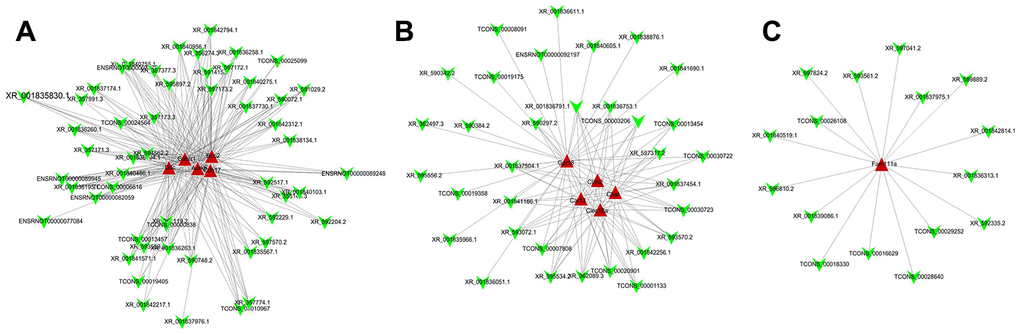
Figure 7. Co-expression network analysis of differentially expressed lncRNA-mRNA. After Pearson correlation analysis between differentially expressed lncRNA and mRNA, (A) 5, (B) 5, and (C) 1 mRNA and their corresponding lncRNA with correlation coefficient >0.8 and P value <0.05 were selected to construct co-expressed network of differentially expressed lncRNA and mRNA.
Construction of lncRNA-miRNA-mRNA regulatory network
186 lncRNA-miRNA regulatory pairs were identified including 108 lncRNAs and mRNA. 368 miRNA-mRNA target pairs were identified including 147 miRNAs and 130 mRNAs. The 67 common miRNAs were identified (Figure 8A). Because of competitively binding miRNA as a miRNA sponge, lncRNAs could form a ceRNA network of lncRNA-miRNA-mRNA to booster miRNA target genes. Based on the regulatory pairs of miRNA-mRNA and lncRNA-miRNA, an lncRNA-miRNA-mRNA network was constructed. A total of 559 lncRNA-miRNA-mRNA target pairs were identified, including 83 lncRNAs, 67 miRNAs, and 108 mRNAs (Figure 8B).
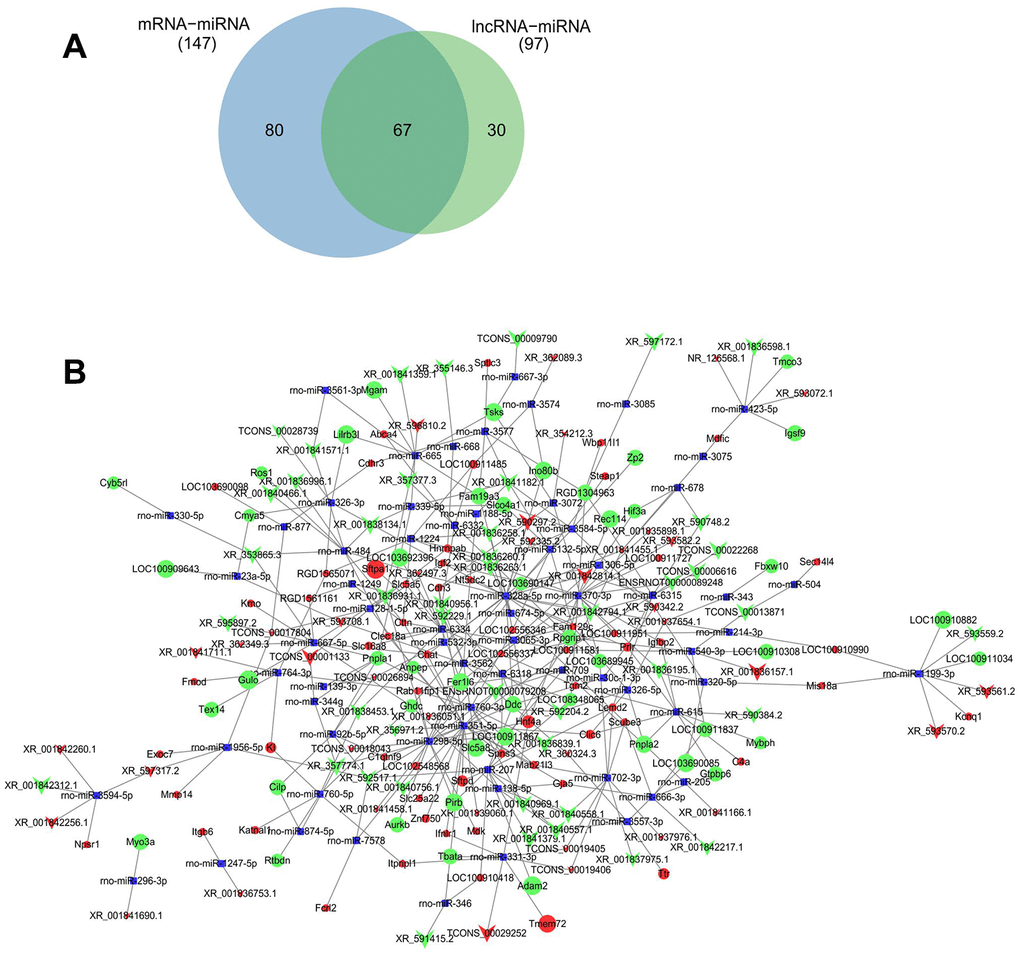
Figure 8. ceRNAs regulatory network of lncRNA-miRNA-mRNA. Predicted common miRNA regulated by differentially expressed lncRNA and mRNA (A). ceRNAs regulatory network of lncRNA-miRNA-mRNA was constructed with differentially expressed lncRNAs and their predicted binding miRNAs, and differentially expressed mRNA and their predicted binding miRNAs by Cytoscape V3.7.0 software (B). Red and green balls represent the upregulated and downregulated mRNAs, red and green arrows represent the upregulated and downregulated lncRNAs, and small blue squares represent miRNA. The size of balls, arrows and squares represents degree of P values.
Validation of lncRNA-miRNA-mRNA regulatory network
To validate the ceRNAs levels of lncRNA-miRNA-mRNA regulatory network, four random lncRNA-miRNA-mRNA target pairs, Itgb6-miR-1247-XR_001836753.1, Npsr1-miR-3594-XR_597317.2, Tsks-miR-667-3p-TCONS_00009790, Cyb5rl-miR-330-XR_353865.3, were selected for qRT-PCR. The results showed that Itgb6 and Npsr1 levels were significantly upregulated and Tsks and Cyb5rl levels were significantly downregulated in hippocampus of CCH animals than that of sham animals (P<0.01) (Figure 9A). As predicted by lncRNA-miRNA-mRNA regulatory network construction, microRNAs rno-miR-1247-5p and rno-miR-3594-5p were significantly down-regulated, and rno-miR-667-3p and rno-miR-330-5p were significantly upregulated in hippocampus of CCH animals than that of sham animals (P<0.01) (Figure 9B). Similarly, lncRNA XR_001836753.1 and XR_597317.2 were significantly upregulated, TCONS_00009790 and XR_353865.3 were significantly down-regulated in hippocampus of CCH animals than that of sham animals (P<0.01) (Figure 9C). The primers used in qRT-PCR are listed in Table 4.
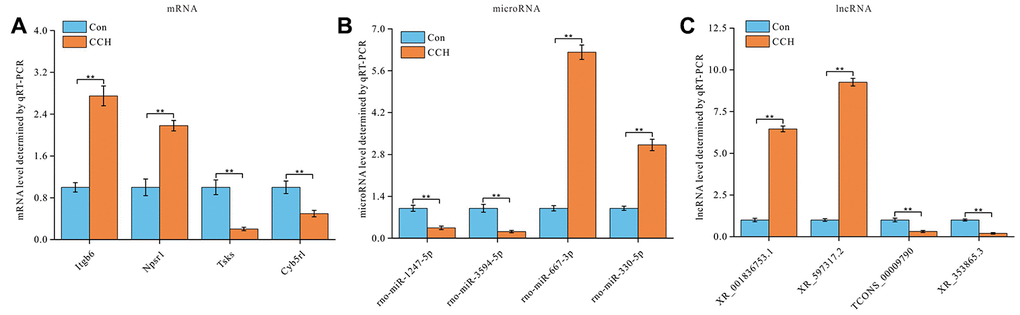
Figure 9. Validation of lncRNAs-miRNAs-mRNAs regulatory network. Four lncRNAs-miRNAs-mRNAs regulatory pairs were selected for validation by qRT-PCR (n=3). (A) mRNA relative level, (B) microRNA relative level, and (C) lncRNA relative level were showed. **, P<0.01.
Table 4. Primers designed for qRT-PCR validation of lncRNAs and mRNAs.
| RNAs | Forward primer | Reverse Primer | Product length(bp) |
| Itgb6 | 5' GGGTCCCTGAATGGTCCAAG 3' | 5' CTCAGAGGCAGCAGTACCAC 3' | 85 |
| Npsr1 | 5' TCATCAAGCAACAGCTCCC 3' | 5' AGCTGGAAAGAATGCATGAGGT 3' | 142 |
| Tsks | 5' CGGGCAGAGTAGATGGTGAG 3' | 5' CCCGCTTCGTGGATCTCAT 3' | 106 |
| Cyb5rl | 5' TTGACACACATGTTGCCAC 3' | 5' TGTCAAGGTCATCAGGCCAC 3' | 161 |
| rno-miR-1247-5p | 5' AACAAGACCCGTCCCGTTC 3' | 5' GTCGTATCCAGTGCAGGGT 3' | 72 |
| rno-miR-3594-5p | 5' AACAATCCCAGGGCAGAGC 3' | 5' GTCGTATCCAGTGCAGGGT 3' | 82 |
| rno-miR-667-3p | 5' AACAATTGACACCTGCCACC 3' | 5' GTCGTATCCAGTGCAGGGT 3' | 72 |
| rno-miR-330-5p | 5' AACGATATCTCTGGGCCTGTG 3' | 5' GTCGTATCCAGTGCAGGGT 3' | 73 |
| XR_001836753.1 | 5' CATGGAGACTTCTTAACACTGAG 3' | 5' CCTTCAAAGCTGTCTGGCTTC 3' | 139 |
| XR_597317.2 | 5' ACCCAGACGTCCTCTTCCT 3' | 5' TATGTTGTCGTTGGAGCCGT 3' | 104 |
| TCONS_00009790 | 5' CGAATACCCTCCCAGCTTCC 3' | 5' TGTTCTGGCAGATTCCCAGTC 3' | 76 |
| XR_353865.3 | 5' CACACCGTTCCAGGGATTG 3' | 5' CCGGATCCCAGCTTTTGAGT 3' | 83 |
Enrichment analyses of the DE lncRNA-miRNA-DE mRNA network
To further predict and analyze the probable functions and pathway of DE mRNAs regulated by DE lncRNA-miRNA, GO and KEGG analysis were performed. The GO analysis showed that the most enriched mRNAs related to lipid homeostasis (GO: 0055088) in biological processes (Figure 10A), the multivesicular body (GO: 0005771) in the cellular component, and hormone activity (GO: 0005179) in the molecular functions (Figure 10B, 10C). KEGG pathway analysis showed that the top 10 deferentially-enriched KEGG pathways related to dysregulated mRNAs were involved in tryptophan metabolism, thyroid hormone synthesis, pertussis, cholinergic synapse, osteoclast differentiation, the Jak-STAT signaling pathway, phagosome, the PI3K-Akt signaling pathway, proteoglycans in cancer, and cytokine-cytokine receptor interaction (Figure 10D).
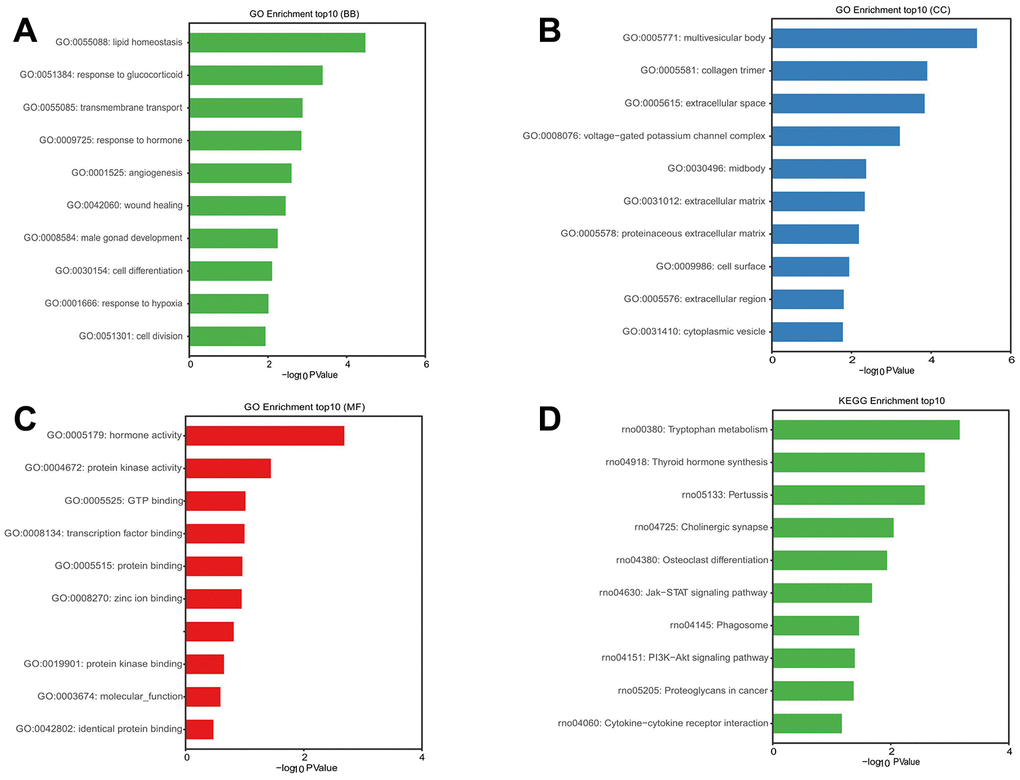
Figure 10. GO and KEGG pathway enrichment analysis of mRNAs in ternary network of lncRNAs-miRNAs-mRNAs.P value <0.05 was as significantly differentially enrichment. Enrichment value (-log10 (P value)) was calculated and visualized to show the enrichment of biological processes (A) the enrichment of cellular components (B) the enrichment of molecular functions (C) and the enrichment of the KEGG functional pathways (D).
Discussion
Cognitive dysfunction caused by CCH is a common and important cause of many neurodegenerative diseases related to cognitive function. The mechanisms of cognitive dysfunction caused by CCH are not clear at present. LncRNA is a kind of noncoding RNA, which is believed to regulate gene transcription and expression. In this study, RNA sequencing analysis showed that 236 mRNAs and 189 lncRNAs were significantly altered in the CCH rat hippocampus when compared to sham controls. Among these, 128 mRNAs and 91 lncRNAs were up-regulated, and 108 mRNAs and 98 lncRNAs were down-regulated. This suggests that these changes in lncRNA and mRNA may function in the changes in brain structure, function, metabolism, and cognitive function caused by CCH.
Many RNA changes in this study are closely related to the changes in synaptic plasticity and cognitive function. Chat codes choline O-acetyltransferase (ChAT), which synthetizes acetylcholine, an important neurotransmitter of cholinergic neurons. Chat is closely related to cognitive function, and there are obvious changes in many stages of AD [26]. Ctnn codes cortactin, which fosters endo-lysosomal sorting and membrane surface distribution of AMPARs, and the LTP and LTD [27, 28]. Gabrr1 codes GABRR1, which is a GABA receptor that functions in neurotransmission of GABAergic neurons. Igf2 codes IGF2, which is one member of the insulin signaling pathway and its deficiency can lead to serious cognition dysfunction and it is involved in impaired cognition in Fragile X syndrome [29]. LOC108348065 codes histone deacetylase 6, which could balance and regulate cognition function. The genetic deletion of the histone deacetylase 6 exacerbates cognition deficits in the Huntington's disease mouse model [30], but reducing HDAC6 ameliorates cognitive deficits in an AD mouse model [31].
In order to better understand the biological functions and potential mechanisms of DE mRNA after chronic cerebral hypoperfusion, the GO and KEGG pathway enrichment analyses were conducted to explore this. The enriched terms in CCH consist of transporter activity (GO: 0005215), integrin binding (GO: 0005178), actin filament binding (GO: 0051015), adherens junction (GO: 0005912), the extracellular space (GO: 0005615), the monocarboxylic acid transport (GO: 0015718), and tryptophan metabolism, and so on. Most of these enriched terms are involved in synaptic plasticity, and myelin integrity, axonal transport and are related to cognition. Dopamine transporter (DAT) can enhance working memory [32]. The αvβ3 integrin receptor is involved in long-term potentiation and long-term depression [33]. The CAMs have been identified to increase synaptic strength at synapse, through recruiting scaffolding proteins, neurotransmitter receptors, and synaptic vesicles, which are closed with synaptic plasticity [34]. Rac1 enhances actin cytoskeleton by phosphorylating cofilin to remodel the structural spine and synaptic plasticity [35]. LncRNAs and their target miRNAs can competitively bind to mRNA as ceRNAs to up-regulate the level of protein-coding genes. Therefore, the lncRNA-miRNA-mRNA ternary network, via the Pearson correlation coefficient of the analysis of two pairs of lncRNAs, predicted miRNA and mRNA, was constructed to study the function of lncRNA regulating mRNA through miRNA. GO and KEGG pathway analyses for the mRNA in this ternary network were conducted to investigate the probable function and potential pathway regulated by lncRNA. The ternary network is involved the hormone activity (GO: 0005179), multivesicular body (GO: 0005771), lipid homeostasis (GO: 0055088), protein kinase binding (GO: 0019901), and transcription factor binding (GO: 0008134), and so on. Most of these enriched terms were also involved in cognition regulation. However, experiments are needed to verify how lncRNA regulates mRNA level through miRNA, and then participates in cognitive dysfunction after CCH. After all, the result inferred from bioinformatics is only a general idea.
LncRNAs can bind and regulate their anti-sense gene transcription in cis and be transported to other locations in the cell to regulate the transcription of genes by acting as scaffolds, decoys, guides, and enhancers to regulate mRNA transcription, and regulate post-translational mRNA level by sponging miRNAs in trans [19, 21]. In present study, we found 91 up-regulated lncRNAs and 98 down-regulated lncRNAs. Because of the numerous regulatory functions of lncRNA, lncRNAs whose levels changed in the hippocampus after chronic cerebral hypoperfusion were predicted to function in cognitive dysfunction. As there are many kinds of molecular up-regulation changes caused by stress response and compensation caused by chronic ischemia and hypoxia in the hippocampus of chronic cerebral hypoperfusion [36, 37], the up-regulated lncRNA may up-regulate the expression of protein molecules in stress and compensation after chronic cerebral hypoperfusion. At the same time, after chronic cerebral hypoperfusion, the energy synthesis of hippocampus decreased, and the synthesis of important protein molecules related to cognitive function decreased [38, 39]. The translation and synthesis of proteins are influenced by microRNA, enhancers, promoters and post-transcriptional modifications. LncRNA can function in these regulatory aspects. Therefore, the down-regulation of lncRNA may reduce the ability to protect mRNA from degradation and cut down mRNA level by decreasing the inhibition of lncRNA on microRNA. In addition, the down-regulation of lncRNA can reduce mRNA transcription by lessening the level of recruitment transcription factors and decreasing the signal guidance of transcription process. In both regulation methods, lncRNA and mRNA are co-expressed in neurons. By predicting the co-expression of lncRNA and mRNA, we can predict the possibility of some interaction or regulation between them. In the present study, we predicted and identified that 161 lncRNAs may be correlated with DE mRNAs via the Pearson correlation analysis. This suggests that these lncRNAs may be involved in the regulation of DE mRNA levels, but this needs to be verified by further experiments.
LncRNA has many functions involved in multiple known and unknown biological processes. The newly discovered neuron-specific nuclear lncRNA neuroLNC fostered presynaptic activity by interacting with TDP-43 [40]. As competitive endogenous RNAs, lncRNA and microRNA can function together to regulate the mRNA level in trans to prevent mRNA against degradation. In the present study, we identified 559 lncRNA-miRNA-mRNA target pairs, including 83 lncRNAs, 67 miRNAs, and 108 mRNAs. These potential triple pairs maybe take part in alterations of function, metabolisms, and structure after CCH, some of which could participate in cognition dysfunction. This potential functional network needs to be verified by further experiments. Such experiments may reveal some very important targets for improving cognitive impairment of CCH.
There were some limitations to our present study. The small sample size may have contributed to the improper estimation of DE RNAs. Future studies with larger sample sizes are needed to verify our present results. Our study results have not been experimentally validated and need verification by further experiments.
In conclusion, our results are helpful for understanding the pathogenesis of cognitive dysfunction caused by CCH and can provide direction for further research.
Material and methods
Animals and CCH model surgery
Adult male Sprague-Dawley rats (200–220 g) were obtained from Hunan SJA Laboratory Animal Co., Ltd., and were housed with accessible food and water ad libitum. Rats were kept on a 12-h light/dark cycle with the light on from 7:00 am to 7:00 pm. Animal welfare and all experiments were approved by Ethics Committee of Renmin Hospital of Wuhan University.
The CCH model surgery was performed as previously described [12]. Briefly, the rats were anesthetized with intraperitoneal chloral hydrate (0.4 g/kg) and placed with a heating pad to maintain the body temperature at 37°C. After a ventral midline incision, both common carotid arteries were gently separated from the carotid sheath and vagus nerve [41]. Bilateral common carotid arteries were doubly ligated with 4-0 silk sutures just below the carotid bifurcation. In control rats, similar surgery was performed, but without vessel ligation. After the surgery was finished, the temperature of the rats was maintained under 37°C until recovery. During surgery, the brains of the rats did not soften, wholly or in part.
Morris water maze
After 30 days of CCH, all rats completed spatial memory training in the Morris water maze. The experiment was conducted as previously described [39]. The rats were trained in the water maze to find a hidden platform. This training comprised four trials per day with a 30-s inter-trial interval between 2:00 and 8:00 pm for seven consecutive days. Each trial started with the rat placed in the middle of the outer edge of one quadrant and facing the wall of the pool, and ended when the animal climbed onto the platform. Rats that could not find the platform in 60 s were guided to the platform. The Morris water maze video tracking analysis system (Shanghai, China) was used to record the activity trajectory of the rats. The swimming paths of the rats and latencies of the rats to find the hidden platform were recorded [42]. The time the rat spent before arriving at the platform during the first trial on each day over a 7-day period was recorded as the latency time. Upon removal of the platform, which occurred during the fourth trial on each day over the 7-day period, the time the rats stayed in the platform area was recorded. The latency time and the number of times the rat crossed the platform area was used to evaluate learning ability. After 1 day of rest, the short-term memory retention test was performed. The platform was either present or absent and rats were put into the first quadrant of the maze. The latency time to reach the platform area, the number of times the rats crossed the platform area, and the total time spent in the platform quadrant, were recorded.
HE staining
After finishing Morris water maze test, rats were anaesthetized by an overdose of chloral hydrate (1 g/kg), perfused, fixed and embedded with paraffins. Brains were cut into sections (5 μm) on slides. Paraffin section was dewaxed at 65°C after further dewaxing in xylene, the slices were hydrated in gradient alcohol. Then the sections were stained in hematoxylin staining solution for 5 minutes. After rinsing, the sections were separated color in alcohol hydrochloric acid for 45 seconds. After re-rinsing again, the sections were stained with eosin for 10 seconds and rinsed again, the slices were dehydrated with gradient alcohol and transparent in xylene. Finally, the sections were mounted with neutral gum and observed under microscope (Olympus BX51, Japan). The neuron morphology and number in hippocampus and striatum were observation and counted for analysis (number per mm2) to evaluate the neuronal pathological changes.
RNA extraction and library preparation
Hippocampi tissue was separated from the rats’ brains, frozen in liquid nitrogen, and stored at -80°C until use. Total RNAs were extracted using the TRIzol reagent (Invitrogen, Singapore) according to the manufacturer’s protocol. RNA purity and quantification were evaluated using the NanoDrop 2000 spectrophotometer (Thermo Fisher Scientific, Waltham, MA, USA). RNA integrity was assessed using the Agilent 2100 Bioanalyzer (Agilent Technologies, Santa Clara, CA, USA). The qualified extracted hippocampal RNA samples must meet the following conditions: the sample concentration is not less than 100 μg/μL; total RNA quantity is greater than or equal to 1μg; the purity of samples requires OD260/280 value between 1.8-2.2; the sample integrity agilent2100 score is greater than or equal to 7 (RIN≥7). Then, the libraries were constructed using TruSeq Stranded Total RNA with Ribo-Zero Gold (Cat. No. RS-122-2301; Illumina, San Diego, CA, USA) according to the manufacturer’s instructions.
RNA sequencing and differentially-expressed RNA (DE RNA) analysis
The libraries were sequenced on an Illumina HiSeq X Ten platform. After removing the adapter, ploy-N, low quality reads, and reads with length less 50 by Trimmomatic software, clean data (clean reads) were obtained. The original sequencing quantity, effective sequencing quantity, Q30 and GC content were counted and evaluated comprehensively. If the quality value is Q30, the probability of error recognition is 0.1%, that is, the accuracy rate is 99.9%. Qualified sequencing results require a quality value of at least 85%.
Sequencing reads were mapped to the human genome (GRCh38) using HISAT2 [43]. For mRNAs, the fragments per kilobase per million (FPKM) [44] of each gene was calculated using Cufflinks 2.0 [45], and the read counts of each gene were obtained by HTSeq-count [46]. Differential expression analysis was performed using the DESeq2 R package [47]. A P value < 0.05 was set as the threshold for significantly differential expression. For lncRNAs, the transcriptome from each dataset was assembled independently using the Cufflinks 2.0 program [45]. All transcriptomes were pooled and merged to generate a final transcriptome using Cuffmerge (Cufflinks 2.0). All transcripts that overlapped with known mRNAs, other non-coding RNA, and non-lncRNA were discarded. Next, the transcripts longer than 200 bp and with a number of exons > 2 were picked out, and CPC (v. 0.9-r2) [48], PLEK (v. 1.2) [49], CNCI (v. 1.0) [50], Pfam (v. 30) [51] were used to predict transcripts with coding potential. The novel predicted lncRNAs were obtained through these processes. The characteristics (including length, type, number of exons) of lncRNA were analyzed after screening. Then, the novel predicted lncRNAs and known lncRNAs (from the NCBI and Ensemble databases) were both used for expression calculation and differential screening. Then, differential expression analysis was performed using the DESeq (2012) R package. All sequencing process and analyses were performed using OE Biotech Co., Ltd. (Shanghai, China).
Validation of quantitative real-time polymerase chain reaction (qRT-PCR)
To verify the validity and accuracy of RNA sequencing, we carried out qRT-PCR assessment to assess the data consistency between RNA sequencing and qRT-PCR. The RNA amplification by qRT-PCR has been described previously [12]. Total RNA of the 50 mg hippocampi tissue was extracted using the TRIzol Reagent according to the manufacturer’s protocol (Invitrogen). First strand complementary DNA (cDNA) was synthesized from total RNA using a First-strand cDNA Synthesis Kit (Thermo Fisher Scientific). The SYBR GREEN Mix (Invitrogen, Waltham, MA USA) reaction system was used for RT-PCR along with the forward primer, the reverse primer, and cDNA. The reaction process included: 1) a preincubation step at 95ºC for 3 min, 2) an amplification step of 45 cycles of 94ºC for 30 s, 3) different annealing temperature and 72ºC for 30 s, and 4) an elongation step of 72ºC for 10 min. A melting curve was recorded to verify the absence of primer dimers. Glyceraldehyde 3-phosphate dehydrogenase (GAPDH) was the endogenous control. RNA levels were assayed using the “ΔΔ Ct method” for relative expression.
GO function and KEGG pathway annotation analyses
Gene Ontology (GO) annotated the gene function in three levels: molecular function, biological process, and cellular component. The main functions of the DE genes could be analyzed by comparisons with genes with annotated functions; therefore, the functions that may be enriched by DE genes were deduced through hypergeometric algorithms and tests to acquire the P value. Similarly, the probable pathway of DE genes was acquired by comparison with genes with an annotated pathway in the database of Kyoto Encyclopedia of Genes and Genomes (KEGG) pathways and by performing hypergeometric algorithms and other tests. A P value < 0.05 was considered statistically significant. The P value determined the degree of the function and pathway enrichment of the DE genes.
LncRNA-mRNA co-expression analyses
For co-expression analysis of lncRNA and the gene, according to the expression levels of DE lncRNA and genes, the Pearson correlation analysis test was used to calculate the correlation between the two expressions. A pairing of a correlation coefficient of > 0.8 and a P value of < 0.05 was considered to indicate a co-expression relationship.
ceRNA construction of the lncRNA-miRNA-mRNA network
The miRbase database and the miRanda program (v. 3.3a) [52] were used to predict the binding between these miRNA-differential mRNA/different lncRNA sequences, using the default parameters of miRanda v. 3.3a (S ≥ 150, ΔG ≤ −30 kcal/mol and demand strict 5' seed pairing), which predicts the miRNA bound to lncRNA and mRNA, respectively, and then takes the intersection to find the miRNA bound to both. S referred to the single residue pair match scores of the matching area, and ΔG referred to free energy of the double chains binding. Then, the intersecting miRNA and the corresponding lncRNA and mRNA were used to construct a ceRNA regulatory network of lnc-miRNA-mRNA using Cytoscape software [53].
Statistical analysis
Data were expressed as means ± standard error of the mean (SEM) and analyzed using SPSS 20.0 statistical software (SPSS Inc., Chicago, IL, USA). The repeated-measures analysis of variance procedure was used to determine the statistical significance of RNAs among the three groups. The one-way analysis of variance procedure followed by Dunnett's t-test was used to determine the statistical significance of differences of the means for comparisons between the two groups. P < 0.05 was considered a statistically significant difference. Fold changes (FCs) and P value of tests were used to determine the statistical significance of the RNA sequence data. A FC ≥ 1.5 and P < 0.05 were used as thresholds for DE lncRNAs and mRNAs.
Author Contributions
Zhao-Hui Yao designed the study. Zhao-Hui Yao, Jing Wang, Yu-Tong Li, Xiao-Li Yao, Shao-Feng Zhang, Yong Zhang, Ji-Chang Hu, and Yan-Chun Xie performed the experiments and data collection. Bing-Zhen Shen provided critical suggestion for the experiments. Zhao-Hui Yao analyzed the data and wrote the manuscript. All authors approved the manuscript.
Acknowledgments
We thank Ms. Qing Wang from OE Biotech Co., Ltd. For her bioinformatics analysis suggestion.
Conflicts of Interest
All authors declare no conflicts of interest to report.
Funding
This work was supported in part by grants from the National Natural Science Foundation of China (NSFC) (81400891), Guiding fund of Renmin hospital of Wuhan University (RMYD2018M31), and Natural Science Foundation of Hubei Province (No.382).
References
- 1. Urbanova BS, Schwabova JP, Magerova H, Jansky P, Markova H, Vyhnalek M, Laczo J, Hort J, Tomek A. Reduced cerebrovascular reserve capacity as a biomarker of microangiopathy in Alzheimer’s disease and mild cognitive impairment. J Alzheimers Dis. 2018; 63:465–77. https://doi.org/10.3233/JAD-170815 [PubMed]
- 2. Hase Y, Polvikoski TM, Firbank MJ, Craggs LJ, Hawthorne E, Platten C, Stevenson W, Deramecourt V, Ballard C, Kenny RA, Perry RH, Ince P, Carare RO, et al. Small vessel disease pathological changes in neurodegenerative and vascular dementias concomitant with autonomic dysfunction. Brain Pathol. 2020; 30:191–202. https://doi.org/10.1111/bpa.12769 [PubMed]
- 3. Tang H, Gao Y, Zhang Q, Nie K, Zhu R, Gao L, Feng S, Wang L, Zhao J, Huang Z, Zhang Y, Wang L. Chronic cerebral hypoperfusion independently exacerbates cognitive impairment within the pathopoiesis of Parkinson’s disease via microvascular pathologys. Behav Brain Res. 2017; 333:286–94. https://doi.org/10.1016/j.bbr.2017.05.061 [PubMed]
- 4. Wang DP, Lv QL, Lin Q, Kang K, Jin KY, Hai J. The cannabinoid receptor agonist WIN55,212-2 ameliorates hippocampal neuronal damage after chronic cerebral hypoperfusion possibly through inhibiting oxidative stress and ASK1-p38 signaling. Neurotox Res. 2020; 37:847–56. https://doi.org/10.1007/s12640-019-00141-8 [PubMed]
- 5. Chen Y, Guo Z, Peng X, Xie W, Chen L, Tan Z. Nimodipine represses AMPK phosphorylation and excessive autophagy after chronic cerebral hypoperfusion in rats. Brain Res Bull. 2018; 140:88–96. https://doi.org/10.1016/j.brainresbull.2018.03.019 [PubMed]
- 6. He J, Huang Y, Du G, Wang Z, Xiang Y, Wang Q. Lasting spatial learning and memory deficits following chronic cerebral hypoperfusion are associated with hippocampal mitochondrial aging in rats. Neuroscience. 2019; 415:215–29. https://doi.org/10.1016/j.neuroscience.2019.04.044 [PubMed]
- 7. Huang L, Zhao LB, Yu ZY, He XJ, Ma LP, Li N, Guo LJ, Feng WY. Long-term inhibition of rho-kinase restores the LTP impaired in chronic forebrain ischemia rats by regulating GABAA and GABAB receptors. Neuroscience. 2014; 277:383–91. https://doi.org/10.1016/j.neuroscience.2014.07.015 [PubMed]
- 8. Toyama K, Spin JM, Deng AC, Huang TT, Wei K, Wagenhäuser MU, Yoshino T, Nguyen H, Mulorz J, Kundu S, Raaz U, Adam M, Schellinger IN, et al. MicroRNA-mediated therapy modulating blood-brain barrier disruption improves vascular cognitive impairment. Arterioscler Thromb Vasc Biol. 2018; 38:1392–406. https://doi.org/10.1161/ATVBAHA.118.310822 [PubMed]
- 9. Wakita H, Tomimoto H, Akiguchi I, Matsuo A, Lin JX, Ihara M, McGeer PL. Axonal damage and demyelination in the white matter after chronic cerebral hypoperfusion in the rat. Brain Res. 2002; 924:63–70. https://doi.org/10.1016/s0006-8993(01)03223-1 [PubMed]
- 10. Zhai Y, Yamashita T, Nakano Y, Sun Z, Morihara R, Fukui Y, Ohta Y, Hishikawa N, Abe K. Disruption of white matter integrity by chronic cerebral hypoperfusion in Alzheimer’s disease mouse model. J Alzheimers Dis. 2016; 52:1311–19. https://doi.org/10.3233/JAD-160120 [PubMed]
- 11. Cespedes A, Villa M, Benito-Cuesta I, Perez-Alvarez MJ, Ordoñez L, Wandosell F. Energy-sensing pathways in ischemia: the counterbalance between AMPK and mTORC. Curr Pharm Des. 2019; 25:4763–70. https://doi.org/10.2174/1381612825666191210152156 [PubMed]
- 12. Xie YC, Yao ZH, Yao XL, Pan JZ, Zhang SF, Zhang Y, Hu JC. Glucagon-like peptide-2 receptor is involved in spatial cognitive dysfunction in rats after chronic cerebral hypoperfusion. J Alzheimers Dis. 2018; 66:1559–76. https://doi.org/10.3233/JAD-180782 [PubMed]
- 13. Wang N, He J, Pan C, Wang J, Ma M, Shi X, Xu Z. Resveratrol activates autophagy via the AKT/mTOR signaling pathway to improve cognitive dysfunction in rats with chronic cerebral hypoperfusion. Front Neurosci. 2019; 13:859. https://doi.org/10.3389/fnins.2019.00859 [PubMed]
- 14. Yang SH, Liu R, Wen Y, Perez E, Cutright J, Brun-Zinkernagel AM, Singh M, Day AL, Simpkins JW. Neuroendocrine mechanism for tolerance to cerebral ischemia-reperfusion injury in male rats. J Neurobiol. 2005; 62:341–51. https://doi.org/10.1002/neu.20103 [PubMed]
- 15. Stanojlović M, Guševac I, Grković I, Zlatković J, Mitrović N, Zarić M, Horvat A, Drakulić D. Effects of chronic cerebral hypoperfusion and low-dose progesterone treatment on apoptotic processes, expression and subcellular localization of key elements within Akt and Erk signaling pathways in rat hippocampus. Neuroscience. 2015; 311:308–21. https://doi.org/10.1016/j.neuroscience.2015.10.040 [PubMed]
- 16. Sanchez Calle A, Kawamura Y, Yamamoto Y, Takeshita F, Ochiya T. Emerging roles of long non-coding RNA in cancer. Cancer Sci. 2018; 109:2093–100. https://doi.org/10.1111/cas.13642 [PubMed]
- 17. Quinn JJ, Chang HY. Unique features of long non-coding RNA biogenesis and function. Nat Rev Genet. 2016; 17:47–62. https://doi.org/10.1038/nrg.2015.10 [PubMed]
- 18. Chen G, Shi T, Shi L. Characterizing and annotating the genome using RNA-seq data. Sci China Life Sci. 2017; 60:116–25. https://doi.org/10.1007/s11427-015-0349-4 [PubMed]
- 19. Tsagakis I, Douka K, Birds I, Aspden JL. Long non-coding RNAs in development and disease: conservation to mechanisms. J Pathol. 2020; 250:480–95. https://doi.org/10.1002/path.5405 [PubMed]
- 20. Ransohoff JD, Wei Y, Khavari PA. The functions and unique features of long intergenic non-coding RNA. Nat Rev Mol Cell Biol. 2018; 19:143–57. https://doi.org/10.1038/nrm.2017.104 [PubMed]
- 21. Uszczynska-Ratajczak B, Lagarde J, Frankish A, Guigó R, Johnson R. Towards a complete map of the human long non-coding RNA transcriptome. Nat Rev Genet. 2018; 19:535–48. https://doi.org/10.1038/s41576-018-0017-y [PubMed]
- 22. Zhang XC, Gu AP, Zheng CY, Li YB, Liang HF, Wang HJ, Tang XL, Bai XX, Cai J. YY1/LncRNA GAS5 complex aggravates cerebral ischemia/reperfusion injury through enhancing neuronal glycolysis. Neuropharmacology. 2019; 158:107682. https://doi.org/10.1016/j.neuropharm.2019.107682 [PubMed]
- 23. Xiao Z, Qiu Y, Lin Y, Medina R, Zhuang S, Rosenblum JS, Cui J, Li Z, Zhang X, Guo L. Blocking lncRNA H19-miR-19a-Id2 axis attenuates hypoxia/ischemia induced neuronal injury. Aging (Albany NY). 2019; 11:3585–600. https://doi.org/10.18632/aging.101999 [PubMed]
- 24. Zhang X, Zhu XL, Ji BY, Cao X, Yu LJ, Zhang Y, Bao XY, Xu Y, Jin JL. LncRNA-1810034E14Rik reduces microglia activation in experimental ischemic stroke. J Neuroinflammation. 2019; 16:75. https://doi.org/10.1186/s12974-019-1464-x [PubMed]
- 25. Li W, Wei D, Liang J, Xie X, Song K, Huang L. Comprehensive evaluation of white matter damage and neuron death and whole-transcriptome analysis of rats with chronic cerebral hypoperfusion. Front Cell Neurosci. 2019; 13:310. https://doi.org/10.3389/fncel.2019.00310 [PubMed]
- 26. Poirel O, Mella S, Videau C, Ramet L, Davoli MA, Herzog E, Katsel P, Mechawar N, Haroutunian V, Epelbaum J, Daumas S, El Mestikawy S. Moderate decline in select synaptic markers in the prefrontal cortex (BA9) of patients with Alzheimer’s disease at various cognitive stages. Sci Rep. 2018; 8:938. https://doi.org/10.1038/s41598-018-19154-y [PubMed]
- 27. Parkinson GT, Chamberlain SE, Jaafari N, Turvey M, Mellor JR, Hanley JG. Cortactin regulates endo-lysosomal sorting of AMPARs via direct interaction with GluA2 subunit. Sci Rep. 2018; 8:4155. https://doi.org/10.1038/s41598-018-22542-z [PubMed]
- 28. Alicea D, Perez M, Maldonado C, Dominicci-Cotto C, Marie B. Cortactin is a regulator of activity-dependent synaptic plasticity controlled by wingless. J Neurosci. 2017; 37:2203–15. https://doi.org/10.1523/JNEUROSCI.1375-16.2017 [PubMed]
- 29. Pardo M, Cheng Y, Velmeshev D, Magistri M, Eldar-Finkelman H, Martinez A, Faghihi MA, Jope RS, Beurel E. Intranasal siRNA administration reveals IGF2 deficiency contributes to impaired cognition in fragile X syndrome mice. JCI Insight. 2017; 2:e91782. https://doi.org/10.1172/jci.insight.91782 [PubMed]
- 30. Ragot A, Pietropaolo S, Vincent J, Delage P, Zhang H, Allinquant B, Leinekugel X, Fischer A, Cho YH. Genetic deletion of the histone deacetylase 6 exacerbates selected behavioral deficits in the R6/1 mouse model for Huntington’s disease. Brain Behav. 2015; 5:e00361. https://doi.org/10.1002/brb3.361 [PubMed]
- 31. Govindarajan N, Rao P, Burkhardt S, Sananbenesi F, Schlüter OM, Bradke F, Lu J, Fischer A. Reducing HDAC6 ameliorates cognitive deficits in a mouse model for Alzheimer’s disease. EMBO Mol Med. 2013; 5:52–63. https://doi.org/10.1002/emmm.201201923 [PubMed]
- 32. Pineau G, Villemonteix T, Slama H, Kavec M, Balériaux D, Metens T, Baijot S, Mary A, Ramoz N, Gorwood P, Peigneux P, Massat I. Dopamine transporter genotype modulates brain activity during a working memory task in children with ADHD. Res Dev Disabil. 2019; 92:103430. https://doi.org/10.1016/j.ridd.2019.103430 [PubMed]
- 33. Bitiktaş S, Tan B, Kavraal Ş, Yousef M, Bayar Y, Dursun N, Süer C. The effects of intra-hippocampal l-thyroxine infusion on long-term potentiation and long-term depression: a possible role for the αvβ3 integrin receptor. J Neurosci Res. 2017; 95:1621–32. https://doi.org/10.1002/jnr.23985 [PubMed]
- 34. Thalhammer A, Cingolani LA. Cell adhesion and homeostatic synaptic plasticity. Neuropharmacology. 2014; 78:23–30. https://doi.org/10.1016/j.neuropharm.2013.03.015 [PubMed]
- 35. Tu X, Yasuda R, Colgan LA. Rac1 is a downstream effector of PKCα in structural synaptic plasticity. Sci Rep. 2020; 10:1777. https://doi.org/10.1038/s41598-020-58610-6 [PubMed]
- 36. Hei Y, Chen R, Yi X, Long Q, Gao D, Liu W. HMGB1 neutralization attenuates hippocampal neuronal death and cognitive impairment in rats with chronic cerebral hypoperfusion via suppressing inflammatory responses and oxidative stress. Neuroscience. 2018; 383:150–59. https://doi.org/10.1016/j.neuroscience.2018.05.010 [PubMed]
- 37. Park JA, Lee CH. Time-course change of Redd1 expressions in the hippocampal CA1 region following chronic cerebral hypoperfusion. Cell Mol Neurobiol. 2017; 37:563–69. https://doi.org/10.1007/s10571-016-0385-9 [PubMed]
- 38. Yang Q, Wu MF, Zhu LH, Qiao LX, Zhao RB, Xia ZK. Long non-coding RNA Snhg3 protects against hypoxia/ischemia-induced neonatal brain injury. Exp Mol Pathol. 2020; 112:104343. https://doi.org/10.1016/j.yexmp.2019.104343 [PubMed]
- 39. Yao ZH, Yao XL, Zhang SF, Hu JC, Zhang Y. Tripchlorolide may improve spatial cognition dysfunction and synaptic plasticity after chronic cerebral hypoperfusion. Neural Plast. 2019; 2019:2158285. https://doi.org/10.1155/2019/2158285 [PubMed]
- 40. Keihani S, Kluever V, Mandad S, Bansal V, Rahman R, Fritsch E, Gomes LC, Gärtner A, Kügler S, Urlaub H, Wren JD, Bonn S, Rizzoli SO, Fornasiero EF. The long noncoding RNA neuroLNC regulates presynaptic activity by interacting with the neurodegeneration-associated protein TDP-43. Sci Adv. 2019; 5:eaay2670. https://doi.org/10.1126/sciadv.aay2670 [PubMed]
- 41. Briones TL, Therrien B, Metzger B. Effects of environment on enhancing functional plasticity following cerebral ischemia. Biol Res Nurs. 2000; 1:299–309. https://doi.org/10.1177/109980040000100406 [PubMed]
- 42. Morris R. Developments of a water-maze procedure for studying spatial learning in the rat. J Neurosci Methods. 1984; 11:47–60. https://doi.org/10.1016/0165-0270(84)90007-4 [PubMed]
- 43. Kim D, Langmead B, Salzberg SL. HISAT: a fast spliced aligner with low memory requirements. Nat Methods. 2015; 12:357–60. https://doi.org/10.1038/nmeth.3317 [PubMed]
- 44. Roberts A, Trapnell C, Donaghey J, Rinn JL, Pachter L. Improving RNA-seq expression estimates by correcting for fragment bias. Genome Biol. 2011; 12:R22. https://doi.org/10.1186/gb-2011-12-3-r22 [PubMed]
- 45. Trapnell C, Williams BA, Pertea G, Mortazavi A, Kwan G, van Baren MJ, Salzberg SL, Wold BJ, Pachter L. Transcript assembly and quantification by RNA-seq reveals unannotated transcripts and isoform switching during cell differentiation. Nat Biotechnol. 2010; 28:511–15. https://doi.org/10.1038/nbt.1621 [PubMed]
- 46. Anders S, Pyl PT, Huber W. HTSeq—a python framework to work with high-throughput sequencing data. Bioinformatics. 2015; 31:166–69. https://doi.org/10.1093/bioinformatics/btu638 [PubMed]
- 47. Anders S, Huber W. Differential expression of RNA-Seq data at the gene level - the DESeq package. EMBL.
- 48. Kong L, Zhang Y, Ye ZQ, Liu XQ, Zhao SQ, Wei L, Gao G. CPC: assess the protein-coding potential of transcripts using sequence features and support vector machine. Nucleic Acids Res. 2007; 35:W345–49. https://doi.org/10.1093/nar/gkm391 [PubMed]
- 49. Li A, Zhang J, Zhou Z. PLEK: a tool for predicting long non-coding RNAs and messenger RNAs based on an improved k-mer scheme. BMC Bioinformatics. 2014; 15:311. https://doi.org/10.1186/1471-2105-15-311 [PubMed]
- 50. Sun L, Luo H, Bu D, Zhao G, Yu K, Zhang C, Liu Y, Chen R, Zhao Y. Utilizing sequence intrinsic composition to classify protein-coding and long non-coding transcripts. Nucleic Acids Res. 2013; 41:e166. https://doi.org/10.1093/nar/gkt646 [PubMed]
- 51. Finn RD, Bateman A, Clements J, Coggill P, Eberhardt RY, Eddy SR, Heger A, Hetherington K, Holm L, Mistry J, Sonnhammer EL, Tate J, Punta M. Pfam: the protein families database. Nucleic Acids Res. 2014; 42:D222–30. https://doi.org/10.1093/nar/gkt1223 [PubMed]
- 52. Betel D, Wilson M, Gabow A, Marks DS, Sander C. The microRNA.org resource: targets and expression. Nucleic Acids Res. 2008; 36:D149–53. https://doi.org/10.1093/nar/gkm995 [PubMed]
- 53. Shannon P, Markiel A, Ozier O, Baliga NS, Wang JT, Ramage D, Amin N, Schwikowski B, Ideker T. Cytoscape: a software environment for integrated models of biomolecular interaction networks. Genome Res. 2003; 13:2498–504. https://doi.org/10.1101/gr.1239303 [PubMed]