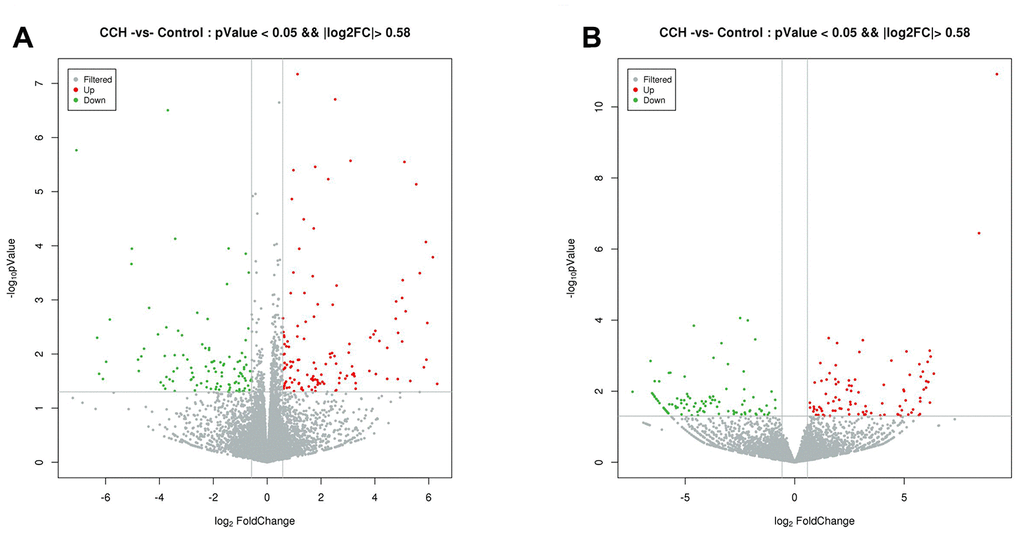
Figure 4.Volcano plot of differentially expressed mRNAs (A) and lncRNAs (B). Normalized fold change and P values (CCH group/sham group) were used to construct the volcano plots. The horizontal and vertical lines represents P value and fold change, respectively. The red and green dots represent statistically significantly upregulated and downregulated mRNAs and lncRNAs. The gray dots represent no statistically significantly altered mRNAs and lncRNAs.