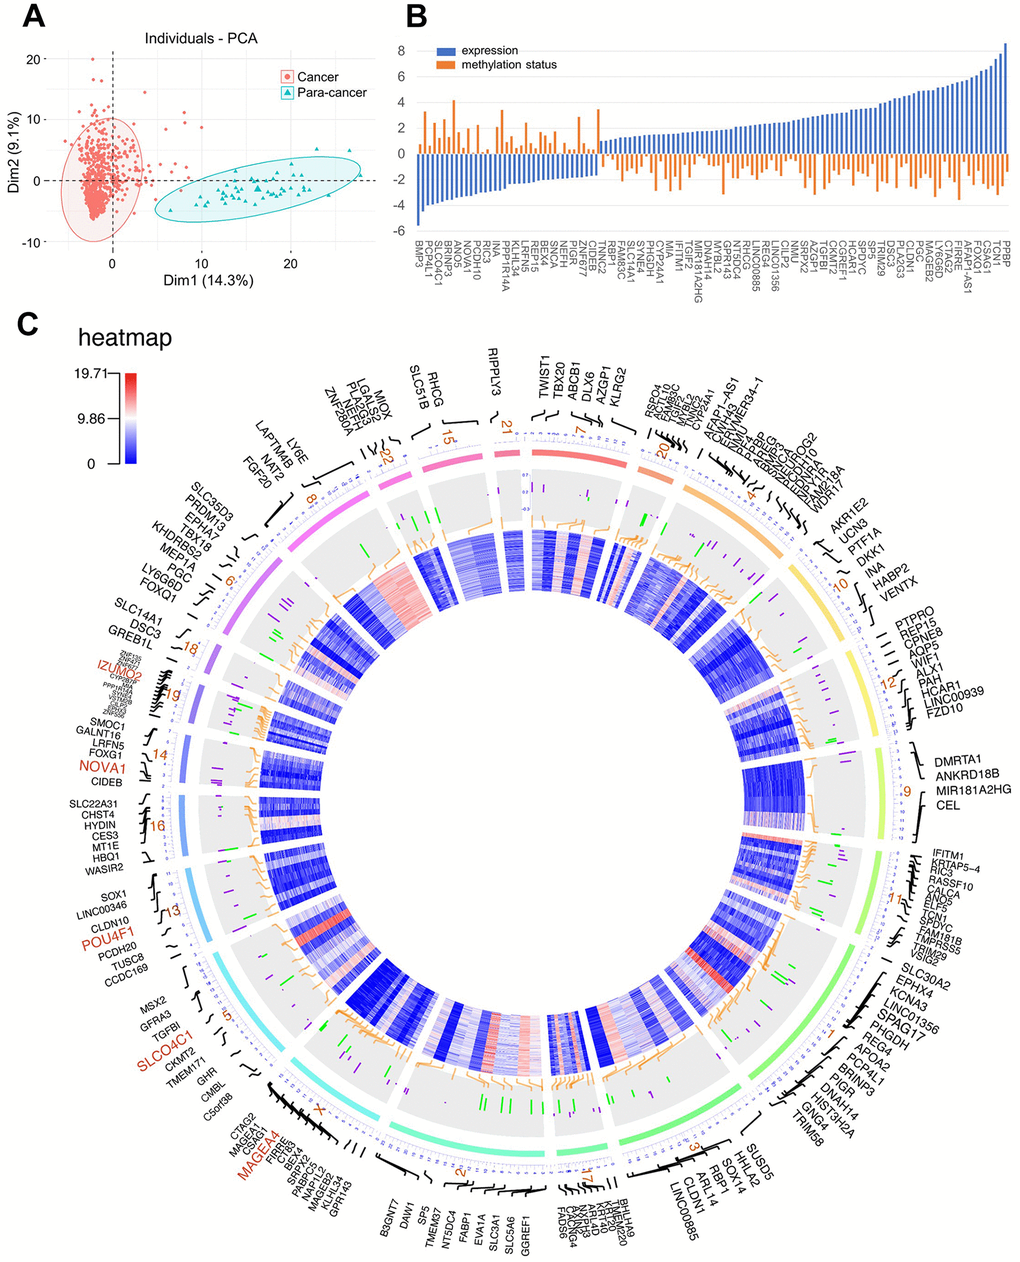
Figure 1.(A) Principal component analysis (PCA) for methylation-driven genes between solid tumor samples and normal samples; (B) The association of methylation status and expression; (C) Circos plot of DNA methylation-driven genes. From the outermost circle to the inner circle, the presentation on the map is as follows: (a) Gene symbol; (b) Chromosome location with lines deriving from specific gene locus; (c) DNA methylation by bar charts (Purple: hypermethylation, Green: hypomethylation); (d) transcriptome expression by heatmap.