


Introduction
Colorectal cancer (CRC) is the third most common malignancy and a leading cause of cancer-related death worldwide [1–3]. In the past decades, the survival of CRC patients has been extended progressively [4]. However, the mortality of CRC is still not satisfactory [5]. CRC is a heterogeneous cancer with a series of critical driver genomic events [6]. Multiple genetic and epigenetic changes in CRC are attracting critical attention. The gene expression profiles and the DNA methylation landscape of CRC have been widely investigated [7, 8]. Consensus molecular subtypes have been identified by Tejpar’s group for future clinical stratification and precision medicine [9]. However, subtypes were generated in a diagnostic way. The prognostic differences in patients couldn’t be reflected [10]. The prognosis of patients with CRC tends to be highly dependent on the individual. The heterogeneity of CRC made it difficult to predict prognosis and make therapeutic decisions [11]. Developing effective biomarkers is essential for improving the clinical outcome.
DNA methylation, one common epigenetic modification in eukaryotic genome [12], always exerts critical functions in regulation of gene expression and histone modifications [13]. Aberrant DNA methylation has been demonstrated as an important mechanism of oncogenic activation [14]. With the development of high-throughput sequencing for DNA methylation, genome-wide DNA methylation could be identified efficiently [15, 16]. Indeed, both hypo- and hypermethylation events in cancer have been reported [17]. The revelation of methylation map could be the key for understanding epigenetic drivers of cancer [18]. Moreover, DNA methylation was dynamic and reversible [19, 20]. The DNA methylation was regulated by DNA methylation regulators such as methyltransferase and demethylase [21]. It is still a great challenge to reveal all the molecular mechanisms and landscape of DNA methylation.
The molecular mechanism of DNA methylation has been demonstrated to be associated with colorectal tumorigenesis [22]. Relative research would be benefit for developing prognostic evaluation and clinical therapy. Bioinformatic analysis showed that some specific gene expression could be predicted by the hypo- and hypermethylation of corresponding genes exactly [23]. Such genes were identified as methylation-driven genes. Further research has reported disease-related DNA methylation-driven genes as biomarkers for early diagnosis or prognosis prediction [24].
Herein, we applied the MethylMix R package [25] to identify the methylation-driven genes in the datasets of patients with CRC from The Cancer Genome Atlas (TCGA) database. Subsequently, the potential clinical significance of these methylation-driven genes was investigated. Some specific methylation-driven genes were indicated to be associated with the prognosis by Cox regression analysis. A risk score model for survival prediction was constructed based on five-gene signature. The performance of this survival model was evaluated by Kaplan-Meier survival analysis and receiver operating characteristic (ROC) analysis. Furthermore, the difference of the pharmaceutical treatment responses between two groups classified by the survival model was investigated. The patients in the high-risk group have a higher probability of suffering clinical processive disease after chemotherapy than patients in the low-risk group. The cases after treatment by Capecitabine (Xeloda) in the high-risk group barely got complete response (CR) while the complete response rate was nearly three quarters in the low-risk group.
Consequently, methylation-driven genes could serve as a potential biomarker for predicting overall survival (OS) with clinical reference for pharmaceutical treatment response.
Results
Identification of methylation-driven genes
In this study, the datasets of patients with CRC were all available from The Cancer Genome Atlas (TCGA). Initially, differential expression genes (DEGs) were screened out by edgeR package with the criterion of FDR < 0.05 and |log2FC| > 1.5 from 688 cohorts involving 638 CRC tissues and 50 normal tissues. A total of 3522 genes were identified as aberrant expressed genes in CRC (Supplementary Table 1, Supplementary Figure 1). Among them, the genes that are transcriptionally predictive by the methylation status of correlated CpG sites were identified as methylation-driven genes. The MethylMix algorithm is utilized to deriving such methylation-driven genes. The methylation status of each CpG site was quantitatively evaluated by the univariate beta mixture model. Then, the specific differentially methylated genes in cancer were identified by the comparative analysis between cancer and normal tissue. Finally, methylation-driven genes were determined by a linear regression model for association between gene expression and methylation status of its corresponding CpG sites. By this method, 181 genes were identified as methylation-driven genes from 352 specimens (308 cancer samples and 45 normal samples) within the RNA-seq data and the matched DNA methylation chip data. (Supplementary Table 2). Principal component analysis (PCA) indicated the significant difference in the expression of methylation-driven genes between cancer samples and control samples (Figure 1A). Individuals from PCA demonstrated that the over-expression of these methylation-driven genes was a significant hallmark of the cancer tumor. After chromosome location annotation, the distribution of 181 DNA methylation-driven genes were revealed. Except for Y-chromosome, DNA methylation-driven genes were distributed in all other chromosomes. In the order of the genes organized along chromosomes, the transcriptome and DNA methylome profiles were showed on the circos plots (Figure 1C). Importantly, most of these methylation-driven genes (123/181, 68.0%) were identified under negative association between methylation status and transcript level (Supplementary Figure 4) which meant that decreased methylation levels correlate with increased expression levels.
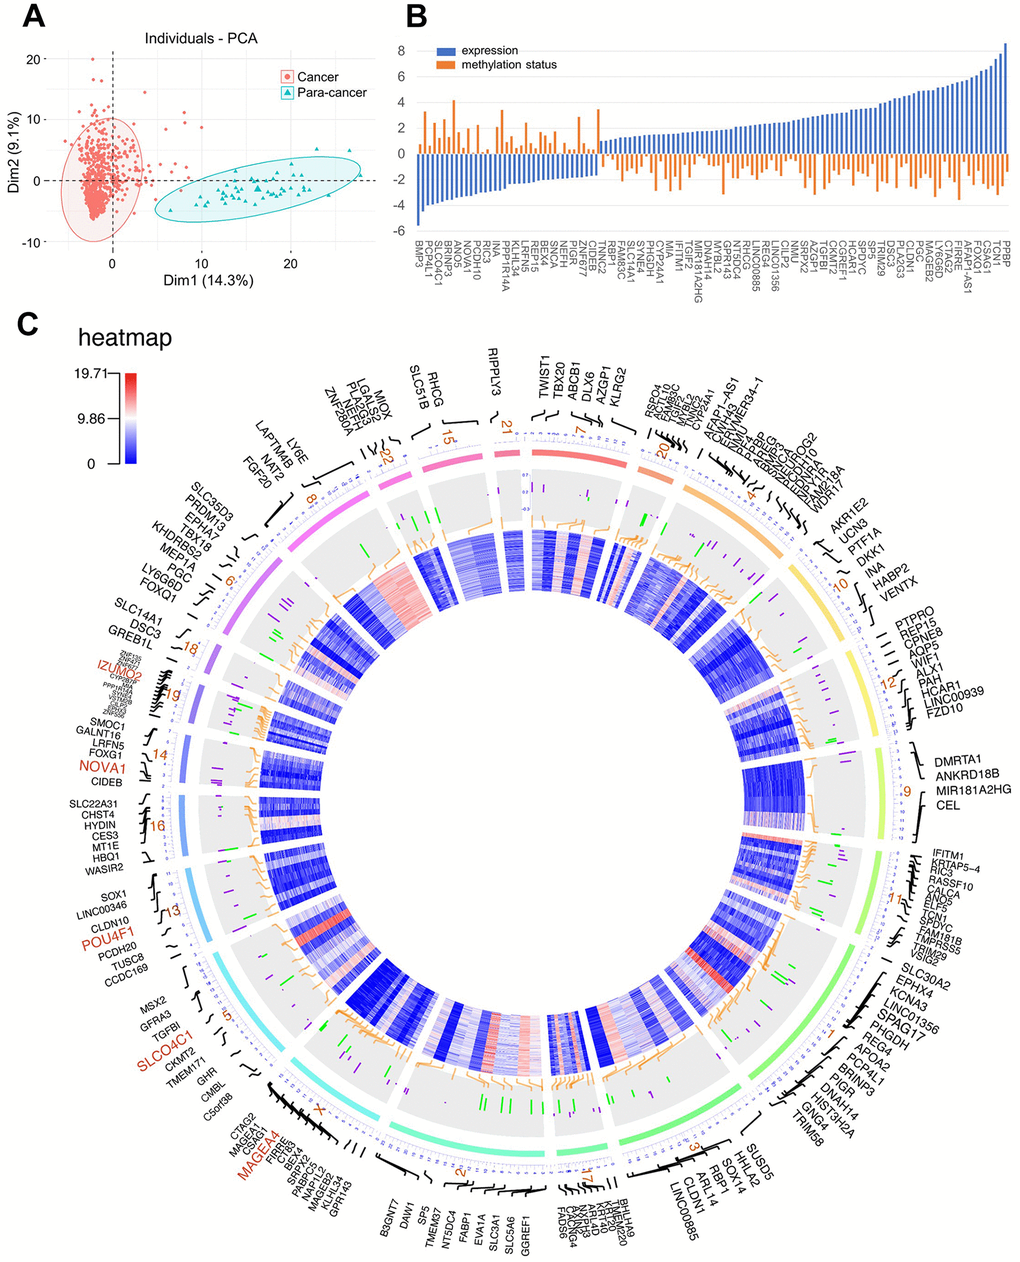
Figure 1. (A) Principal component analysis (PCA) for methylation-driven genes between solid tumor samples and normal samples; (B) The association of methylation status and expression; (C) Circos plot of DNA methylation-driven genes. From the outermost circle to the inner circle, the presentation on the map is as follows: (a) Gene symbol; (b) Chromosome location with lines deriving from specific gene locus; (c) DNA methylation by bar charts (Purple: hypermethylation, Green: hypomethylation); (d) transcriptome expression by heatmap.
Furthermore, Two-third methylation-driven genes (118/181, 65.2%) were overexpressed in CRC tissue. They were considered as potential biomarkers for disease phenotype or clinical features. In further trials, a total of 18 genes were demonstrated to be associated with the prognosis of CRC (Supplementary Figure 7). Among them, five genes (POU4F1, NOVA1, MAGEA1, SLCO4C1, and IZUMO2) which were highlighted by the red color were recruited to construct the prediction risk model by multivariate Cox regression analysis.
Functional analysis of the DNA methylation-driven genes
After identification of the methylation-driven genes associated with CRC, the molecular functions of these genes were investigated. As shown in Figure 2, the functional categories of 181 methylation-driven genes were defined by the gene-set enrichment analysis (GSEA) analysis (Supplementary Figure 6). The enrichment analysis showed that methylation-driven genes play critical roles in multiple categories involving 27 GO biological process (BP) terms, 5 GO cell component (CC) and 11 GO molecular functions (MF) terms (Supplementary Table 4). Overall, the functions of these genes mainly focused on the regulation of transcription. Especially, activity of RNA polymerase II was identified as the key factor. Besides that, the overexpression of these genes would promote cell adhesion and cell proliferation which are biological characteristics of cancer cells. The results were consistent with their roles in oncogenesis as methylation-driven genes. As for 18 survival-associated methylation-driven genes, the individual functional annotation table was record in supporting material (Supplementary Table 5). Finally, the biological processes regulated by the 5 genes in the risk score model were investigated by individual GO analysis (Supplementary Table 6). The results indicated that they were association with the transcription as the negative regulators of RNA polymerase II promoter (Figure 2B).
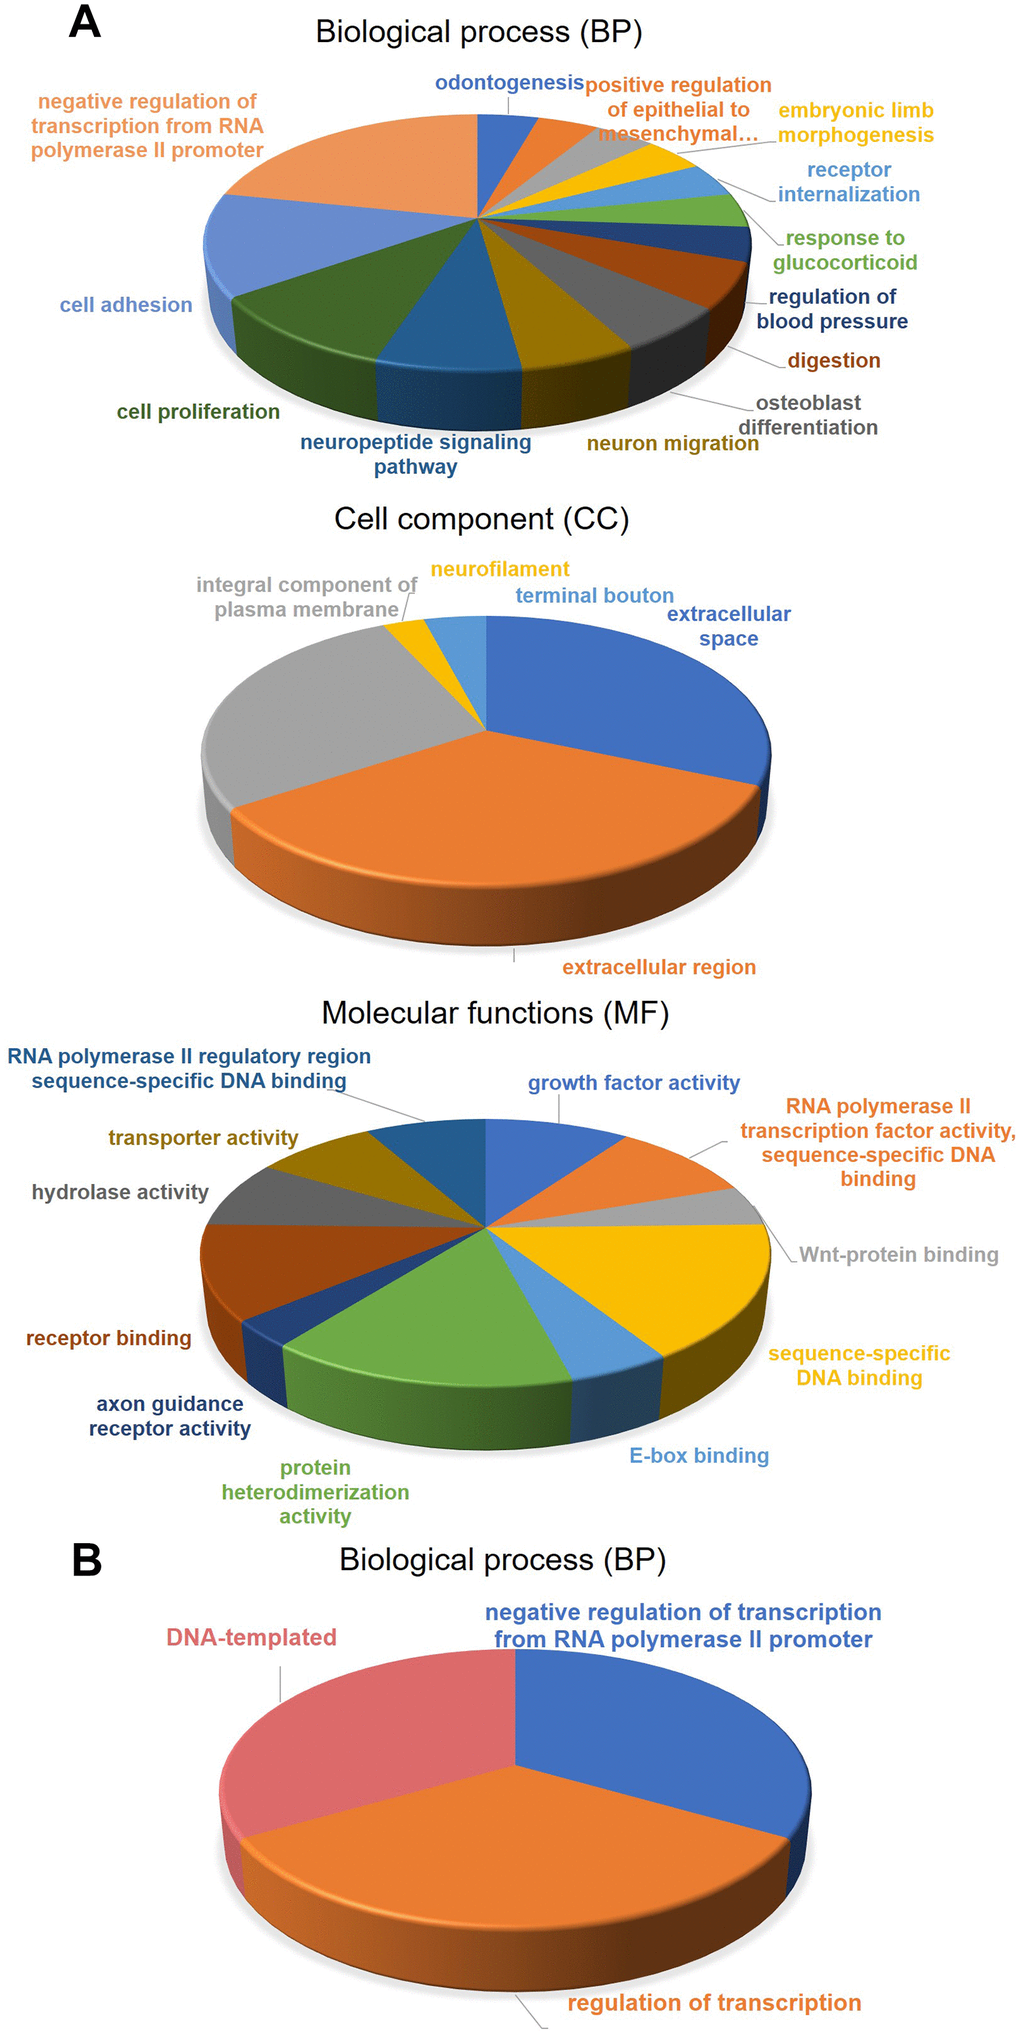
Figure 2. Gene-set enrichment analysis (GSEA) for methylation-driven genes. (A) molecular functions, biological process, and Cell component of 181 methylation-driven genes. (B) biological process of 5 genes in the risk model.
Identification of methylation-driven genes associated with overall survival (OS)
A total of 581 patients diagnosed with CRCs were included in the survival analysis. The median age was 68 years (range, 30–89 years). The information of TNM classification was displayed in Table 1. The Cox proportional hazard regression analysis was employed to investigate the association between methylation-driven genes and clinical survival time in the CRC patients. Initially, a total of 18 genes among the methylation-driven genes were identified to be significantly associated with OS of patients with CRCs (p-value < 0.005) by univariate Cox regression analysis (Table 2). And the significant analysis for association between the OS and expression of the individual gene was investigated by log-rank test (Figure 3). Focused on these genes, multivariate Cox regression analysis was further performed to construct a scoring model for survival prediction. By the Akaike Information Criterion (AIC), 9 genes (ZNF556, CILP2, NAT2, REP15, SUSD5, MIOX, RSPO4, PPP1R14A and LY6E) were eliminated (Supplementary Table 4). Then, step elimination optimization was proposed to ensure all the genes in models were statistically significant (p-value < 0.01, Table 3) Finally, the expression of five genes (POU4F1, NOVA1, MAGEA1, SLCO4C1, IZUMO2) were defined as the index to obtain the risk assessment model (Table 3, Figure 4A, 4B). The risk scoring formula was defined as follows: RiskScore=POU4F1×1.2040333+NOVA1×1.1272212+MAGEA1×1.1276608+SLCO4C1×0.8003405+ IZUMO2×0.8645822.
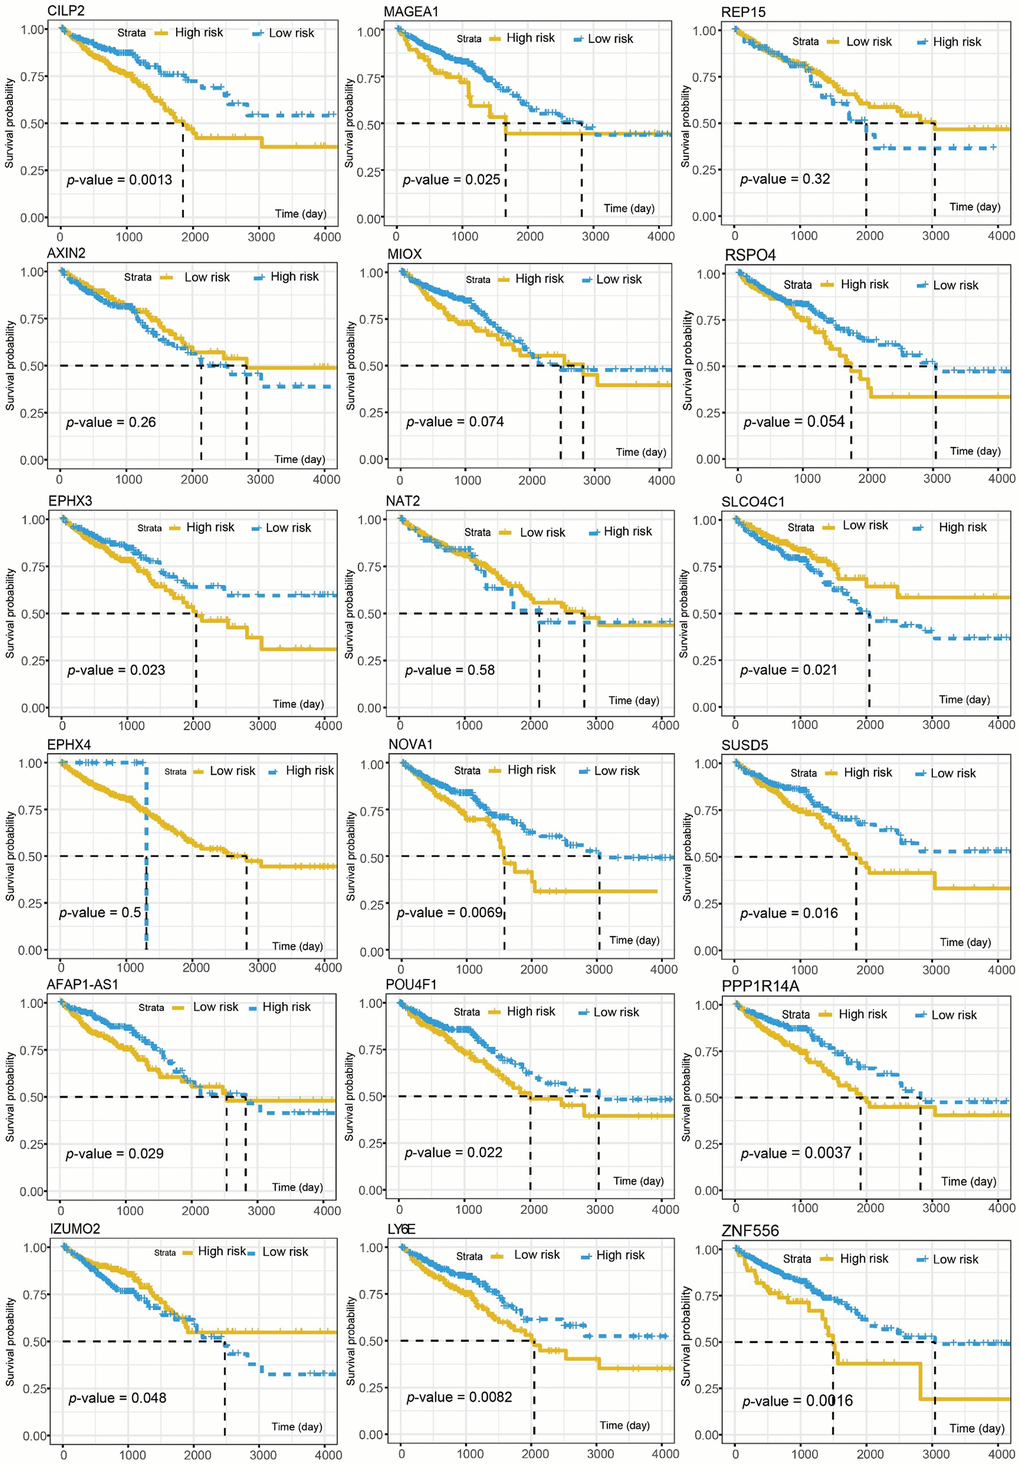
Figure 3. The association between the OS and individual gene expression of the 18 survival-associated genes.
Table 1. Clinicopathological characteristics of CRC patients from TCGA.
| Variables | Patients | |||||
| Total | Training dataset | Test dataset | ||||
| No. | % | No. | % | No. | % | |
| Gender | ||||||
| Female | 310 | 53.91% | 221 | 54.84% | 89 | 51.45% |
| Male | 265 | 46.09% | 181 | 44.91% | 84 | 48.55% |
| Age at diagnosis | ||||||
| Median | 68 | 68 | 67 | |||
| Range | 31-90 | 34-90 | 37-90 | |||
| >60 | 392 | 68.17% | 277 | 68.73% | 117 | 67.63% |
| <61 | 183 | 31.83% | 126 | 31.27% | 52 | 30.06% |
| TNM stage (T) | ||||||
| T1 | 19 | 3.30% | 9 | 2.23% | 10 | 5.78% |
| T2 | 102 | 17.74% | 66 | 16.38% | 36 | 20.81% |
| T3 | 393 | 68.35% | 282 | 69.98% | 111 | 64.16% |
| T4 | 61 | 10.61% | 45 | 11.17% | 16 | 9.25% |
| TNM stage (N) | ||||||
| N0 | 327 | 56.87% | 222 | 55.09% | 105 | 60.69% |
| N1 | 142 | 24.70% | 97 | 24.07% | 45 | 26.01% |
| N2 | 106 | 18.43% | 83 | 20.60% | 23 | 13.29% |
| TNM stage (M) | ||||||
| M0 | 435 | 75.65% | 303 | 75.19% | 132 | 76.30% |
| M1 | 82 | 14.26% | 58 | 14.39% | 24 | 13.87% |
| Mx | 58 | 10.09% | 41 | 10.17% | 17 | 9.83% |
Table 2. The results of univariate Cox analysis.
| Gene | HR | z | 95%CI | p value |
| SLCO4C1 | 0.8560 | -2.9084 | 0.86 [0.77, 0.95] | 0.0036 |
| ZNF556 | 1.1087 | 2.8937 | 1.11 [1.03, 1.19] | 0.0038 |
| MAGEA1 | 1.1157 | 2.7109 | 1.12 [1.03, 1.21] | 0.0067 |
| AFAP1.AS1 | 1.0764 | 2.6837 | 1.08 [1.02, 1.14] | 0.0073 |
| CILP2 | 1.1273 | 2.6260 | 1.13 [1.03, 1.23] | 0.0086 |
| NAT2 | 0.8921 | -2.5460 | 0.89 [0.82, 0.97] | 0.0109 |
| REP15 | 0.8971 | -2.4593 | 0.90 [0.82, 0.98] | 0.0139 |
| POU4F1 | 1.1202 | 2.4028 | 1.12 [1.02, 1.23] | 0.0163 |
| EPHX4 | 0.8765 | -2.2504 | 0.88 [0.78, 0.98] | 0.0244 |
| MIOX | 1.1170 | 2.1943 | 1.12 [1.01, 1.23] | 0.0282 |
| SUSD5 | 1.1184 | 2.1421 | 1.12 [1.01, 1.24] | 0.0322 |
| RSPO4 | 1.0843 | 2.1218 | 1.08 [1.01, 1.17] | 0.0339 |
| IZUMO2 | 0.9140 | -2.1136 | 0.91 [0.84, 0.99] | 0.0346 |
| NOVA1 | 1.1012 | 2.0521 | 1.10 [1.00, 1.21] | 0.0402 |
| EPHX3 | 1.1272 | 2.0510 | 1.13 [1.01, 1.26] | 0.0403 |
| AXIN2 | 0.8946 | -2.0120 | 0.89 [0.80, 1.00] | 0.0442 |
| PPP1R14A | 1.1511 | 1.9970 | 1.15 [1.00, 1.32] | 0.0458 |
| LY6E | 1.1462 | 1.9954 | 1.15 [1.00, 1.31] | 0.0460 |
Table 3. The results of multivariate Cox analysis.
| Gene | coef | exp(coef) | se(coef) | z | Pr(>|z|) |
| SLCO4C1 | -0.2227 | 0.8003 | 0.0556 | -4.0087 | 0.000061 |
| MAGEA1 | 0.1201 | 1.1277 | 0.0412 | 2.9166 | 0.003539 |
| POU4F1 | 0.1857 | 1.2040 | 0.0508 | 3.6529 | 0.000259 |
| IZUMO2 | -0.1455 | 0.8646 | 0.0459 | -3.1668 | 0.001541 |
| NOVA1 | 0.1198 | 1.1272 | 0.0451 | 2.6533 | 0.007972 |
The median value of the RiskScore (0.961639) was defined as the intergroup cut-off value. According to this value, the specimens could be classified into high-risk group and low-risk group. Further, Mann–Whitney testing indicated significant differential expression of individual genes in the risk model between the high-risk group and the low-risk group (Figure 4C). The correlation between expression of the five genes and the methylation status was verified by Pearson correlation coefficient (Supplementary Figure 2, Supplementary Table 3). However, there is no evidence for association between OS and methylation pattern of these genes. (Supplementary Figure 9) The methylation β mixed model of these genes was shown in Figure 4D. The black horizontal line was the scale for indicating the methylation status in normal specimens. The curves were fitted with the subgroups of differential methylation in the cancer group, and it could represent the trend of methylation distribution in CRC tissues.
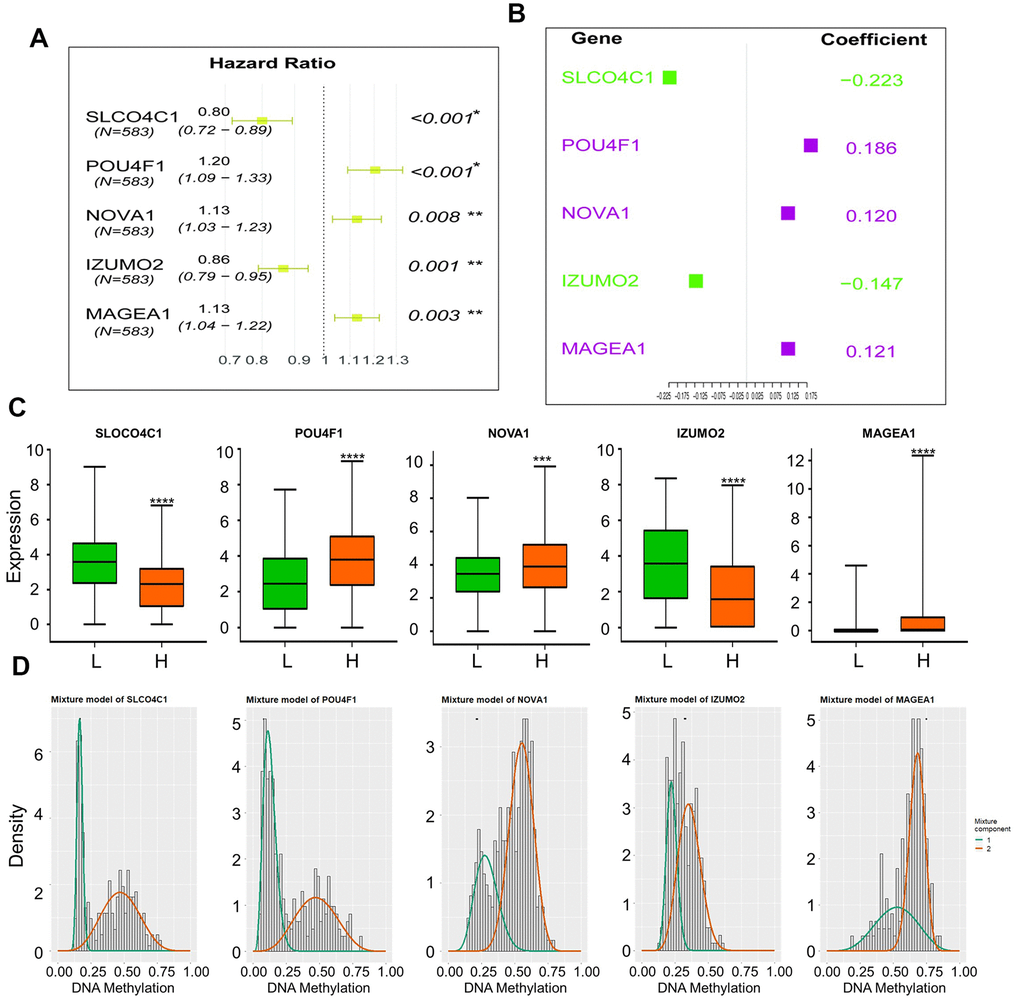
Figure 4. (A) Hazard Ratio of genes form the survival model; (B) Coefficient of genes form the survival model; (C) Expression of five genes in high-risk and low-risk groups, (“L”: low-risk group, “H”: high-risk group), Mann–Whitney test was used to evaluate the differences between the two groups,****: p-value < 0.0001, ***: p-value = 0.0002; (D) Mixture models of five genes.
Predictive performance of the methylation-driven gene signature
The 581 specimens were separated randomly into a training dataset (402 samples) and a validation dataset (173 specimens) with a ratio of 3:1. The Kaplan–Meier analysis was performed to evaluate the predictive value of this risk assessment model in the prognosis. The p-value from log-rank tests and hazard ratios (HRs) from the Cox regression analysis indicated that our hazard model based on five methylation-driven genes was significantly associated with the OS of patients with CRC (Training dataset: p-value < 0.005, HR: 2.543, 95% CI: 1.291–5.008; Validation dataset: p-value < 0.005, HR: 2.075, 95% CI: 1.421–3.029, Figure 5A). The sensitivity and specificity of our prognosis risk assessment model were verified by the receiver operating characteristic (ROC) curve (Figure 5C). The AUC values of both datasets (training dataset: 0.644, testing dataset: 0.819) indicated that our risk assessment model could be an effective marker for predicting the prognosis of CRC. For all the specimens, the cohort was classified into two groups according to the median value of the RiskScore. The Kaplan–Meier curve showed that our five-gene signature could accurately distinguish high- and low-risk patients with CRC significantly (p-value < 0.0001, HR: 2.034, 95% CI: 1.419-2.916). The Harrell’s C index revealed a value of 0.655. This meant that a significant difference between the high-risk group and the low-risk group. The mean OS of patents in the high-risk group was 2003 days while the mean OS in the low-risk group was identified as NA because of the expectable good prognosis. By the same way, the effectiveness of five-gene model was validated in an independent GEO cohort (GSE39582, Figure 6A). Specifically, the result from the multivariate Cox analysis for the clinical characteristics (age, sex, grade, and TNM classification) and RiskScore demonstrated the independence of our risk assessment model (Table 4). Moreover, the effect of risk factors for predicting survival could be evaluated by the nomogram (Figure 5D, Supplementary Figure 3). Compare to clinical characteristics including age, gender and TNM classification, RiskScore based on five methylation-driven gene signature occupied maximum proportion in the pointing system. It means that RiskScore played the most important role in predicting system.
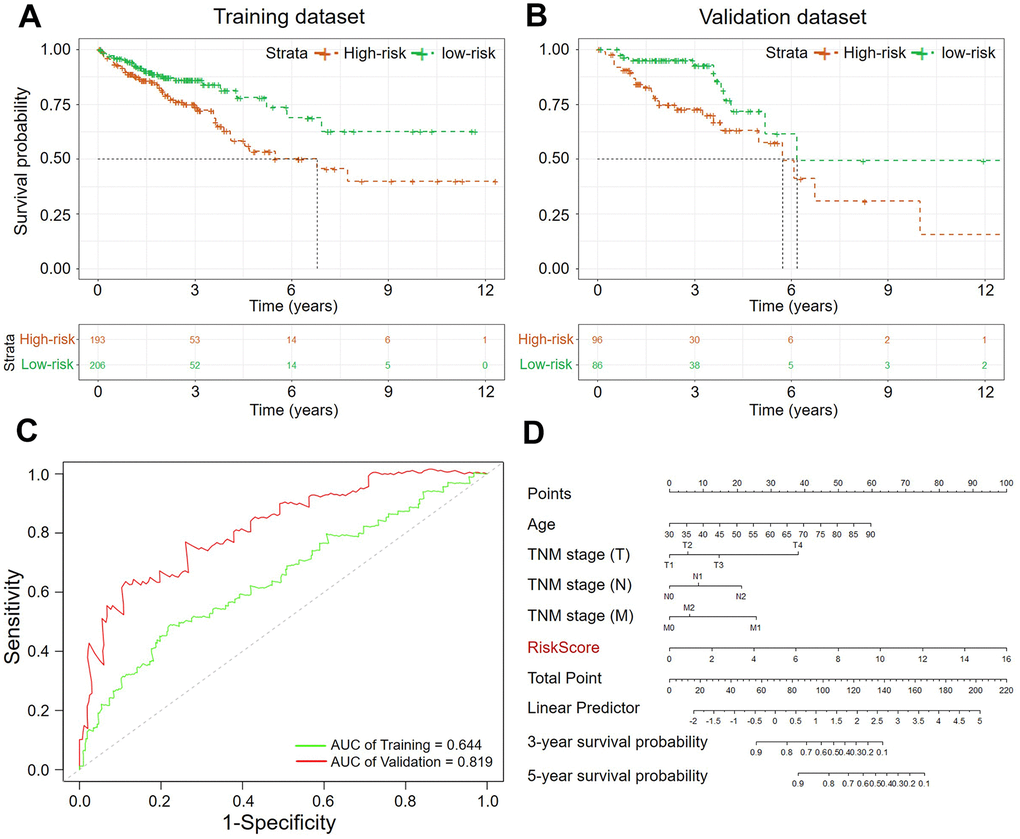
Figure 5. The Kaplan–Meier curves of the OS for high-risk and low-risk. (A) Training dataset (p-value < 0.005); (B) Validation dataset (p-value < 0.005); (C) ROC analysis of sensitivity and specificity (Green: Training dataset, Red: Validation dataset; (D) Nomogram of clinicopathological characteristics and RiskScore.
Table 4. The predictive values of related clinical characteristics and RiskScore.
| Clinical Characteristic | coef | exp(coef) | se(coef) | z | Pr(>|z|) |
| TNM stage (T) | 0.7595 | 2.1372 | 0.2029 | 3.742 | 0.000182 |
| TNM stage (N) | 0.5062 | 1.6590 | 0.1187 | 4.266 | 0.000020 |
| TNM stage (M) | 0.2624 | 1.3001 | 0.1248 | 2.102 | 0.035549 |
| age | 0.0334 | 1.0340 | 0.0081 | 4.127 | 0.000037 |
| gender | 0.0287 | 1.0291 | 0.1880 | 0.153 | 0.878587 |
| RiskScore | 0.2500 | 1.2841 | 0.0436 | 5.741 | 9.39E-09 |
Finally, the prognostic value of our methylation-driven gene signature was validated in 23 patient tumor samples provided by Cancer Hospital of China Medical University, Liaoning Cancer Hospital and Institute. The detail of clinical information was list in the supporting information (Supplementary Table 8). Total RNA had been extracted for the solid tissues and gene expression profiles were detected by qPCR (Supplementary Figure 10 and Supplementary Tables 7, 9). Similarly, the risk score from the 5-gene signature divided patients into high- and low-risk groups. Kaplan–Meier curves indicated significant differences between the two groups (log-rank test, p-value < 0.05; Figure 6D) All the results demonstrated that the prognosis risk assessment model based on the five-gene signature could be an independent applicable predictor for prognosis in evaluation in CRC patients.
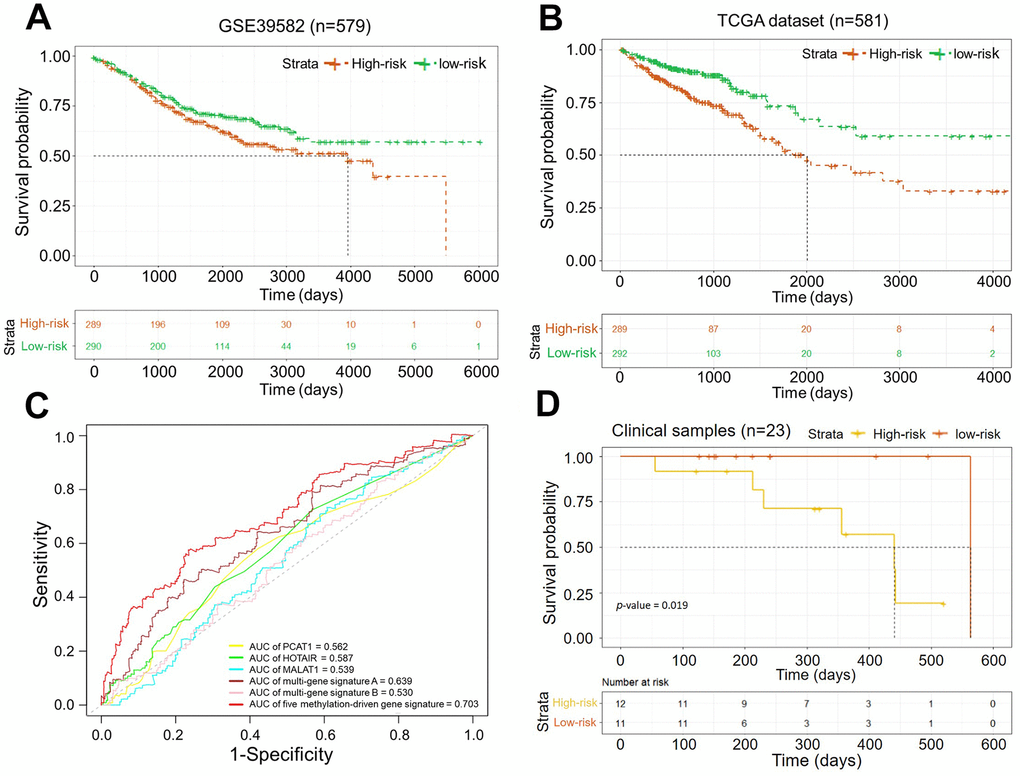
Figure 6. (A) Kaplan–Meier curves of the OS in dataset GSE39582 (p-value < 0.05); (B) Kaplan–Meier curves of the OS in the dataset from TCGA (p-value = 0.0001); (C) ROC curves of five methylation-driven gene signature and other known biomarkers for prognosis in CRCs. (D) Kaplan–Meier curves of the OS in clinical samples (p-value = 0.019).
Comparison of prognosis model based on methylation-driven genes with other known biomarkers
In recent years, several prognostic biomarkers in CRC based on molecular features such as aberrant expressions were developed. For instance, high expression of MALAT1 suggested poor prognosis in CRC patients [26]. HOTAIR could be identified as a negative prognostic factor both in primary tumors and blood of CRC patients [27, 28]. PCAT-1, identified as prostate cancer–associated ncRNA transcripts 1, was also demonstrated to be associated with worse prognosis clinical outcomes in CRC [29]. Furthermore, multi-gene signatures were also developed as novel prognosis biomarkers by multivariate Cox analysis. H. Chen, Sun, et al. [30] reported a seven-gene signature (PPIP5K2, PTPRB, NHLRC3, PRR14L, CCBL1, PNPO, and ZDHHC21) as prognostic biomarkers by analyzing a gene microarray of 64 specimens. Zhuang Li, et al. [31] developed a five-gene signature (KIF15, NAT2, GPX3, SCG2, and CLCA1) for predicting the OS of CRC patients in two independent GEO cohorts.
Herein, the sensitivity and specificity of above known biomarkers and our risk assessment model were verified uniformly by ROC analyses. The data from TCGA program (COAD, READ) were used as the validation dataset. As a result, our risk assessment model based on five methylation-driven genes showed effective and reliable performance (Figure 5C). The signature of five methylation-driven genes was demonstrated to be an effective predictor for OS of patients with CRC.
Pharmaceutical treatment response of patients from the risk assessment model
More than the prognosis, the differences in pharmaceutical treatment response between the high-risk group and the low-risk group were observed. the clinical information of pharmaceutical therapy events and the matched treatment responses were also available in TCGA database. A total of 828 events of pharmaceutical therapy from 232 patients with CRC were recorded. According to the Riskscore, the patients were classified in the high-risk group and the low-risk group. Then, statistical analysis revealed the difference of treatment responses between two groups. Generally, treatment response of patients in the low-risk group was better of the two groups. The proportion of patients with complete response (CR), partial response (PR), progressive disease (PD) and stable disease (SD) and were 53.0%, 10.6%, 27.3% and 9.1% in the high-risk group and 67.2%, 10.3%, 15.5% and 6.9% in the low-risk group, respectively. Two thirds of cases from the low-risk group achieved clinical complete response after chemoradiotherapy vs 53% in the high-risk group. Moreover, patients in the high-risk group had higher rates of suffering clinical progressive diseases after chemotherapy (27.3% vs 15.5%). Treatment responses of specific drugs were displayed by pie charts (Figure 7A). Among them, significant difference in CR rates of treatment by capecitabine (Xeloda) was observed. The CR rates were 75% in the low-risk group while 12.5% in the high-risk group. Different efficacy of capecitabine (Xeloda) was reflected. We extracted the patients treated with Capecitabine (Xeloda) from the TCGA datasets and carried out systematic survival analyses. The association between the OS and individual gene was investigated (Supplementary Figure 8.). Consistently, the risk scores from the methylation-driven gene signature indicated the risk of prognosis. As shown in Figure 7B, the significant different of OS in two group was demonstrated by the log-rank test (p-value < 0.00032).
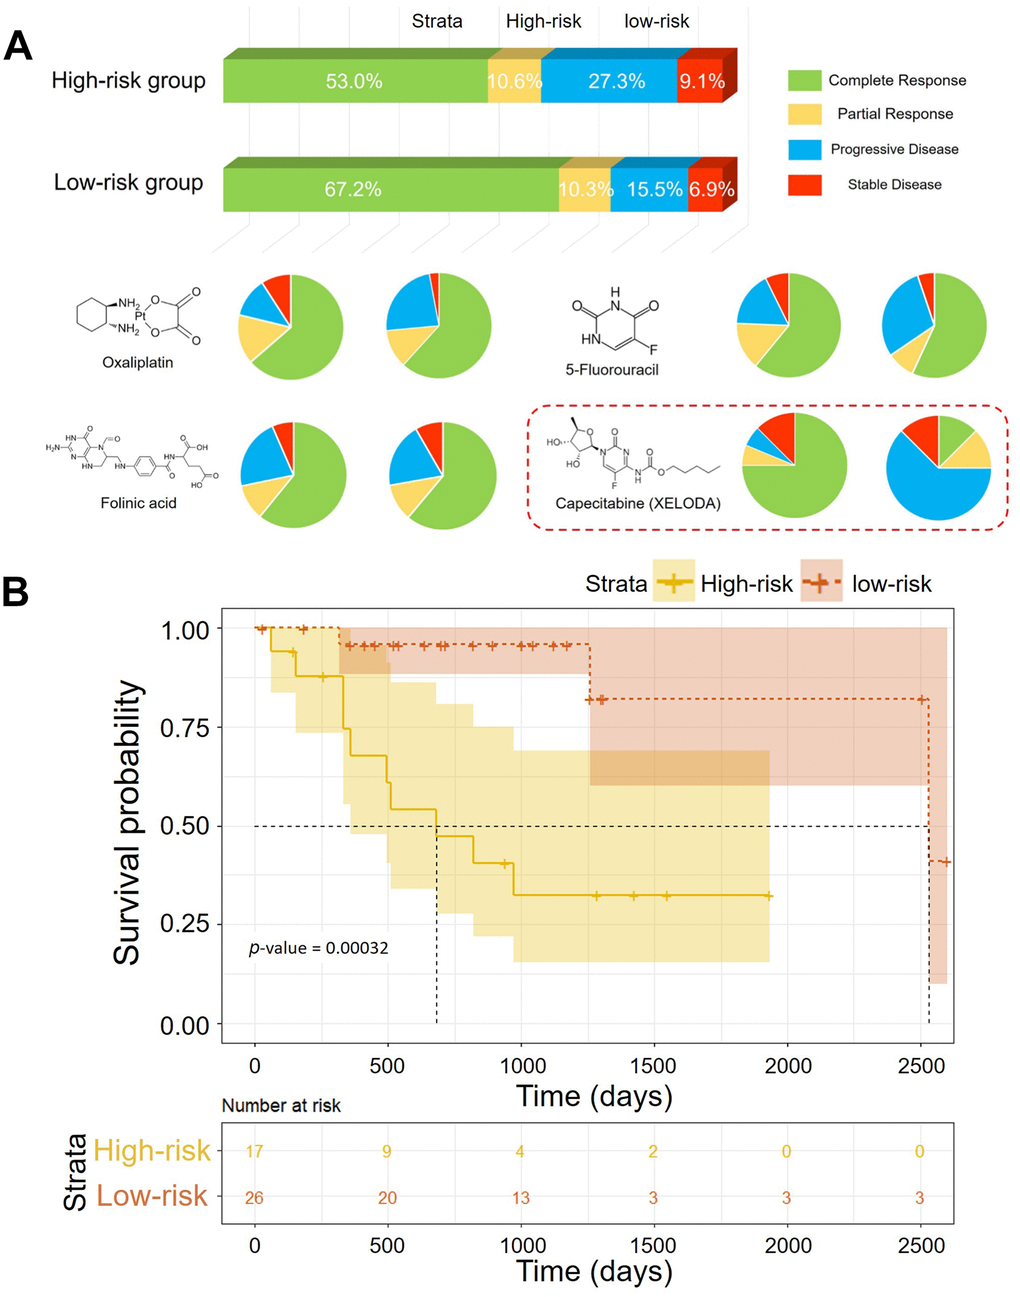
Figure 7. (A) Pharmaceutical treatment responses of patients in the low-risk group and the high-risk group. (B) Kaplan–Meier curves of the OS of patients treated with XELODA in TCGA (p-value = 0.00032).
Discussion
Critical driver genomic events that contribute to oncogenesis are important mechanisms of the developmental processes of CRC. Molecular signatures such as aberrant expression, mutation, and methylation have been indicated to be various biomarkers. For example, oncogenes like PCAT-1[29], MALAT1 [26], and NDRG4 [32] which associated with progression in pan-cancer had also been identified as prognostic biomarkers in CRC. High HOTAIR expression in primary tumors or in the blood of CRC patients was associated with poor prognosis [28]. With the development of high through-put technology, it’s convenient to get gene expression profiles. The clinical values of multi-gene signatures were widely investigated. However, it is difficult to evaluate the prognostic value of biomarkers uniformly because of the differences in analysis methods and data sources. As potential effective and convenient biomarkers, DEG-based signature is deserved to be further investigated.
DNA methylation was an important epigenetic event in driving oncogenesis. DNA methylation on specific sites could regulate corresponding gene expression. Such gene was identified as methylation-driven gene. Cancer-specific methylation-driven genes were demonstrated with vital clinical value [33].
In this study, a total of 181 genes were identified as CRC-specific methylation-driven genes. Functional enrichment analysis indicated that these genes would contribute to the cell cellular transformation and aberrant translation in CRC. Then, 18 genes among the 181 methylation-driven genes were demonstrated to be associated with the OS of CRC patients. Based on these survival-related genes, the five-gene signature (SLCO4C1, MAGEA1, POU4F1, IZUMO2, and NOVA1) was developed as a prognostic prediction biomarker for CRC (Supplementary Figure 5). In previous research, SLCO4C1 promoter methylation have been identified as prognostic biomarker for prostate cancer [34]. NOVA1 was proven to be a crucial factor promoting telomerase activity in cancer cells [35]. The aberrant expression of MAGE-A1 and POU4F1 was also reported to be associated with multiple diseases [36, 37]. In this study, there five-gene signature construct a risk assessment model for predicting the prognosis of patients with CRC. Genes ontology annotation indicated that they could increase the translation by negative regulation of RNA polymerase II promoter. The sensitivity and specificity of the model were verified by Harrell’s C index and receiver operating characteristic (ROC) analysis. The log-rank test demonstrated that there was significant difference between the high-risk group and the low-risk group (p-value < 0.0001, log-rank). Multivariate Cox analysis and nomogram indicated that the five-gene signature was an independent prognostic biomarker for CRC. Thus, the signature of the five CRC-specific methylation-driven indicators should be an effective prognostic candidate biomarker. However, the prognostic value of this assessment model needs to be further verified by clinical trials in the future.
More than other biomarkers based on DEG, the expression of methylation-driven genes was associated with the DNA methylation status of corresponding sites. Correlation between the expression of five genes and methylation status was demonstrated by Pearson correlation coefficient. According to the expression, the foregoing hyper-or hypomethylation events could be inferenced. This could be convenient for assessing the cross-omics molecular features of tumor tissue.
Furthermore, DNA methylation has been reported as a possible driver of therapeutic resistance. Importantly, the difference in pharmaceutical treatment response between the high-risk group and the low-risk group was observed. Patients in the high-risk group are more likely to suffer clinical progressive diseases after chemotherapy. This might be one reason of the shorter OS. Especially, Capecitabine (XELODA) hardly got complete response from patients in the high-risk group. Similarly, DNA methylation was reported to lead to capecitabine resistance in mesothelioma [38]. Although, the underlying mechanism in CRC remains unclear, some reference suggestions for clinical therapy will be provided by the signature of five methylation-driven genes.
Conclusions
In conclusion, the methylation-driven genes associated with CRC were identified by analyzing gene-expression profiles and corresponding DNA methylation data which are available at the TCGA database. Among these genes, a total of 18 genes were indicated to be significantly associated with the OS of patients. A risk assessment model for predicting the prognosis was constructed based on five methylation-driven genes. After verification, the signature of five methylation-driven genes was demonstrated to be an independent prognostic biomarker for CRC. Further clinical response evaluation indicated that the patients classified as high risk would always be with worse pharmaceutical treatment response. Our findings would provide a novel biomarker for improving the clinical outcome of CRC patients and new insights into aberrant DNA methylation in CRC.
Materials and Methods
DNA methylation data and gene expression data preprocessing
The data for DNA methylation, RNA-Sequencing (RNA-Seq) and corresponding clinical information were downloaded for The Cancer Genome Atlas (TCGA). The DNA methylation data had been generated from the Illumina Infinium Human Methylation 450K platform. The DNA methylation status was evaluated by β value after preprocessing. RNA sequencing data were normalized by the “edgeR” package in R software. Specimens used for survival analysis required complete survival information. Clinical samples were provided by Cancer Hospital of China Medical University. Liaoning Cancer Hospital and Institute.
Analysis of differentially expressed genes
After preprocessing, differentially expressed genes (DEGs) were screened out by means of the quasi-likelihood F test as per its instruction. We as a result selected the differential genes with |logFC| > 1.5 and p-value < 0.05 for further research.
Identification of methylation-driven genes
The methylation-driven genes were identified by the "methylmix" package. The specimens used for analyzing contained both DNA methylation chip data and corresponding RNA-seq data. For investigating the correlation between methylation status and expression (cis-regulation) of specific genes, the methylation status of each gene was evaluated by a single-variable β mixed model based on Bayesian information criterion (BIC) and the Wilcoxon rank sum test. Linear regression was used to simulate the correlation between the methylation status and expression profile of each gene. The genes were identified as methylation-driven genes if the correlation coefficient was low than -0.4 and |DM-values (differential methylation values)|>0. Chromosome positions of DNA methylation-driven genes were visualized by “OmicCircos” (R package). The methylation status and the copy number variation were displayed synchronically.
Gene Ontology enrichment analysis of DNA methylation-driven genes
The “clusterProfiler” package was used to perform gene set enrichment analysis of gene-set enrichment analysis (GSEA) on DNA methylation-driven genes with p-value-Cutoff was set at 0.05 as the filter criteria. After that, “enrichplot” package was operated to visualize holistic authentic results.
Cox regression analysis
The Cox regression analysis was conducted by using “survival” package. We performed univariate Cox regression analysis of all DNA methylation-driver genes in TCGA following removing censored data, from which eighteen genes were identified for they were significantly associated with survival (p value < 0.05). After that, multivariate cox regression analysis was performed to explore the association between the survival time of patients and predictor variables thus building a risk model. Finally, five genes were obtained for risk assessment and risk assessment formula was:
where Coefi belongs to the coefficient of a specific model gene, and Expi pertains to the expression level of each selected gene. The Harrell’s C index was calculated by the “survcomp” package.
Survival analysis
The prognostic value of risk score based on methylation-driven genes on OS of patients with CRC was investigated by Kaplan–Meier analysis with log-rank test (Mantel–Cox) using the “survival” package. ROC curves were built by the “survivalROC” package. Nomogram analysis for independence of biomarkers were performed with “rms” package.
Ethics statement
Ethical approval has been obtained by The Cancer Genome Atlas. (TCGA, https://tcga-data.nci.nih.gov/tcga/). The expression array database (GSE39582) were downloaded from the Gene Expression Omnibus (GEO, https://www.ncbi.nlm.nih.gov/geo/).
Supplementary Materials
Author Contributions
MJW and WHZ conceived and designed the study. FBS and DC carried out the data analysis, interpreted the entire results, and drafted the manuscript. ZY and WZK helped to carry out the data analysis. All authors read and approved the final manuscript.
Acknowledgments
The datasets used in this manuscript are accessible in The Cancer Genome Atlas (TCGA) database. Network: https://cancergenome.nih.gov/.
Conflicts of Interest
All authors declare that they have no conflicts of interest.
Funding
This work was supported by grants from the National Natural Science Foundation of China [81872905, 31828005, 81673475], National Natural Science Foundation of China and Liaoning joint fund key program [U1608281], Liaoning Revitalization Talents Program [XLYC1807155], China Postdoctoral Science Foundation [2019M661180 and 2019T120225], Shenyang S&T Projects [19-109-4-09], and the Science and Technology Innovative Foundation for Young and Middle-aged Scientists of Shenyang City [RC200382]. Key R&D Guidance Plan Projects in Liaoning Province [2019JH8/10300011].
References
- 1. Siegel RL, Miller KD, Jemal A. Cancer statistics, 2020. CA Cancer J Clin. 2020; 70:7–30. https://doi.org/10.3322/caac.21590 [PubMed]
- 2. Bray F, Ferlay J, Soerjomataram I, Siegel RL, Torre LA, Jemal A. Global cancer statistics 2018: GLOBOCAN estimates of incidence and mortality worldwide for 36 cancers in 185 countries. CA Cancer J Clin. 2018; 68:394–424. https://doi.org/10.3322/caac.21492 [PubMed]
- 3. Siegel RL, Miller KD, Fedewa SA, Ahnen DJ, Meester RG, Barzi A, Jemal A. Colorectal cancer statistics, 2017. CA Cancer J Clin. 2017; 67:177–93. https://doi.org/10.3322/caac.21395 [PubMed]
- 4. Cremolini C, Schirripa M, Antoniotti C, Moretto R, Salvatore L, Masi G, Falcone A, Loupakis F. First-line chemotherapy for mCRC—a review and evidence-based algorithm. Nat Rev Clin Oncol. 2015; 12:607–19. https://doi.org/10.1038/nrclinonc.2015.129 [PubMed]
- 5. Arnold M, Sierra MS, Laversanne M, Soerjomataram I, Jemal A, Bray F. Global patterns and trends in colorectal cancer incidence and mortality. Gut. 2017; 66:683–91. https://doi.org/10.1136/gutjnl-2015-310912 [PubMed]
- 6. Bogaert J, Prenen H. Molecular genetics of colorectal cancer. Ann Gastroenterol. 2014; 27:9–14. https://doi.org/10.1111/j.1749-6632.1995.tb12114.x [PubMed]
- 7. Hinoue T, Weisenberger DJ, Lange CP, Shen H, Byun HM, Van Den Berg D, Malik S, Pan F, Noushmehr H, van Dijk CM, Tollenaar RA, Laird PW. Genome-scale analysis of aberrant DNA methylation in colorectal cancer. Genome Res. 2012; 22:271–82. https://doi.org/10.1101/gr.117523.110 [PubMed]
- 8. Wood LD, Parsons DW, Jones S, Lin J, Sjöblom T, Leary RJ, Shen D, Boca SM, Barber T, Ptak J, Silliman N, Szabo S, Dezso Z, et al. The genomic landscapes of human breast and colorectal cancers. Science. 2007; 318:1108–13. https://doi.org/10.1126/science.1145720 [PubMed]
- 9. Guinney J, Dienstmann R, Wang X, de Reyniès A, Schlicker A, Soneson C, Marisa L, Roepman P, Nyamundanda G, Angelino P, Bot BM, Morris JS, Simon IM, et al. The consensus molecular subtypes of colorectal cancer. Nat Med. 2015; 21:1350–56. https://doi.org/10.1038/nm.3967 [PubMed]
- 10. Dienstmann R, Vermeulen L, Guinney J, Kopetz S, Tejpar S, Tabernero J. Consensus molecular subtypes and the evolution of precision medicine in colorectal cancer. Nat Rev Cancer. 2017; 17:79–92. https://doi.org/10.1038/nrc.2016.126 [PubMed]
- 11. Dunne PD, McArt DG, Bradley CA, O’Reilly PG, Barrett HL, Cummins R, O’Grady T, Arthur K, Loughrey MB, Allen WL, McDade SS, Waugh DJ, Hamilton PW, et al. Challenging the cancer molecular stratification dogma: intratumoral heterogeneity undermines consensus molecular subtypes and potential diagnostic value in colorectal cancer. Clin Cancer Res. 2016; 22:4095–104. https://doi.org/10.1158/1078-0432.CCR-16-0032 [PubMed]
- 12. Suzuki MM, Bird A. DNA methylation landscapes: provocative insights from epigenomics. Nat Rev Genet. 2008; 9:465–76. https://doi.org/10.1038/nrg2341 [PubMed]
- 13. Smith ZD, Meissner A. DNA methylation: roles in mammalian development. Nat Rev Genet. 2013; 14:204–20. https://doi.org/10.1038/nrg3354 [PubMed]
- 14. Das PM, Singal R. DNA methylation and cancer. J Clin Oncol. 2004; 22:4632–42. https://doi.org/10.1200/JCO.2004.07.151 [PubMed]
- 15. Meissner A, Gnirke A, Bell GW, Ramsahoye B, Lander ES, Jaenisch R. Reduced representation bisulfite sequencing for comparative high-resolution DNA methylation analysis. Nucleic Acids Res. 2005; 33:5868–77. https://doi.org/10.1093/nar/gki901 [PubMed]
- 16. Flusberg BA, Webster DR, Lee JH, Travers KJ, Olivares EC, Clark TA, Korlach J, Turner SW. Direct detection of DNA methylation during single-molecule, real-time sequencing. Nat Methods. 2010; 7:461–65. https://doi.org/10.1038/nmeth.1459 [PubMed]
- 17. McCabe MT, Brandes JC, Vertino PM. Cancer DNA methylation: molecular mechanisms and clinical implications. Clin Cancer Res. 2009; 15:3927–37. https://doi.org/10.1158/1078-0432.CCR-08-2784 [PubMed]
- 18. Elsässer SJ, Allis CD, Lewis PW. Cancer. New epigenetic drivers of cancers. Science. 2011; 331:1145–46. https://doi.org/10.1126/science.1203280 [PubMed]
- 19. Bestor TH, Edwards JR, Boulard M. Notes on the role of dynamic DNA methylation in mammalian development. Proc Natl Acad Sci USA. 2015; 112:6796–99. https://doi.org/10.1073/pnas.1415301111 [PubMed]
- 20. Ramchandani S, Bhattacharya SK, Cervoni N, Szyf M. DNA methylation is a reversible biological signal. Proc Natl Acad Sci USA. 1999; 96:6107–12. https://doi.org/10.1073/pnas.96.11.6107 [PubMed]
- 21. Robertson KD. DNA methylation, methyltransferases, and cancer. Oncogene. 2001; 20:3139–55. https://doi.org/10.1038/sj.onc.1204341 [PubMed]
- 22. Sahnane N, Magnoli F, Bernasconi B, Tibiletti MG, Romualdi C, Pedroni M, Ponz de Leon M, Magnani G, Reggiani-Bonetti L, Bertario L, Signoroni S, Capella C, Sessa F, Furlan D, and AIFEG. Aberrant DNA methylation profiles of inherited and sporadic colorectal cancer. Clin Epigenetics. 2015; 7:131. https://doi.org/10.1186/s13148-015-0165-2 [PubMed]
- 23. Huang WY, Hsu SD, Huang HY, Sun YM, Chou CH, Weng SL, Huang HD. MethHC: a database of DNA methylation and gene expression in human cancer. Nucleic Acids Res. 2015; 43:D856–61. https://doi.org/10.1093/nar/gku1151 [PubMed]
- 24. Lu T, Chen D, Wang Y, Sun X, Li S, Miao S, Wo Y, Dong Y, Leng X, Du W, Jiao W. Identification of DNA methylation-driven genes in esophageal squamous cell carcinoma: a study based on the cancer genome atlas. Cancer Cell Int. 2019; 19:52. https://doi.org/10.1186/s12935-019-0770-9 [PubMed]
- 25. Gevaert O. MethylMix: an R package for identifying DNA methylation-driven genes. Bioinformatics. 2015; 31:1839–41. https://doi.org/10.1093/bioinformatics/btv020 [PubMed]
- 26. Zheng HT, Shi DB, Wang YW, Li XX, Xu Y, Tripathi P, Gu WL, Cai GX, Cai SJ. High expression of lncRNA MALAT1 suggests a biomarker of poor prognosis in colorectal cancer. Int J Clin Exp Pathol. 2014; 7:3174–81. [PubMed]
- 27. Kogo R, Shimamura T, Mimori K, Kawahara K, Imoto S, Sudo T, Tanaka F, Shibata K, Suzuki A, Komune S, Miyano S, Mori M. Long noncoding RNA HOTAIR regulates polycomb-dependent chromatin modification and is associated with poor prognosis in colorectal cancers. Cancer Res. 2011; 71:6320–26. https://doi.org/10.1158/0008-5472.CAN-11-1021 [PubMed]
- 28. Svoboda M, Slyskova J, Schneiderova M, Makovicky P, Bielik L, Levy M, Lipska L, Hemmelova B, Kala Z, Protivankova M, Vycital O, Liska V, Schwarzova L, et al. HOTAIR long non-coding RNA is a negative prognostic factor not only in primary tumors, but also in the blood of colorectal cancer patients. Carcinogenesis. 2014; 35:1510–15. https://doi.org/10.1093/carcin/bgu055 [PubMed]
- 29. Ge X, Chen Y, Liao X, Liu D, Li F, Ruan H, Jia W. Overexpression of long noncoding RNA PCAT-1 is a novel biomarker of poor prognosis in patients with colorectal cancer. Med Oncol. 2013; 30:588. https://doi.org/10.1007/s12032-013-0588-6 [PubMed]
- 30. Chen H, Sun X, Ge W, Qian Y, Bai R, Zheng S. A seven-gene signature predicts overall survival of patients with colorectal cancer. Oncotarget. 2016; 8:95054–65. https://doi.org/10.18632/oncotarget.10982 [PubMed]
- 31. Sun G, Li Y, Peng Y, Lu D, Zhang F, Cui X, Zhang Q, Li Z. Identification of a five-gene signature with prognostic value in colorectal cancer. J Cell Physiol. 2019; 234:3829–36. https://doi.org/10.1002/jcp.27154 [PubMed]
- 32. Chu D, Zhang Z, Zhou Y, Li Y, Zhu S, Zhang J, Zhao Q, Ji G, Wang W, Zheng J. NDRG4, a novel candidate tumor suppressor, is a predictor of overall survival of colorectal cancer patients. Oncotarget. 2015; 6:7584–96. https://doi.org/10.18632/oncotarget.3170 [PubMed]
- 33. Xu N, Wu YP, Ke ZB, Liang YC, Cai H, Su WT, Tao X, Chen SH, Zheng QS, Wei Y, Xue XY. Identification of key DNA methylation-driven genes in prostate adenocarcinoma: an integrative analysis of TCGA methylation data. J Transl Med. 2019; 17:311. https://doi.org/10.1186/s12967-019-2065-2 [PubMed]
- 34. Li X, Zhang W, Song J, Zhang X, Ran L, He Y. SLCO4C1 promoter methylation is a potential biomarker for prognosis associated with biochemical recurrence-free survival after radical prostatectomy. Clin Epigenetics. 2019; 11:99. https://doi.org/10.1186/s13148-019-0693-2 [PubMed]
- 35. Sayed ME, Yuan L, Robin JD, Tedone E, Batten K, Dahlson N, Wright WE, Shay JW, Ludlow AT. NOVA1 directs PTBP1 to hTERT pre-mRNA and promotes telomerase activity in cancer cells. Oncogene. 2019; 38:2937–52. https://doi.org/10.1038/s41388-018-0639-8 [PubMed]
- 36. Qiu G, Fang J, He Y. 5’ CpG island methylation analysis identifies the MAGE-A1 and MAGE-A3 genes as potential markers of HCC. Clin Biochem. 2006; 39:259–66. https://doi.org/10.1016/j.clinbiochem.2006.01.014 [PubMed]
- 37. Fortier JM, Payton JE, Cahan P, Ley TJ, Walter MJ, Graubert TA. POU4F1 is associated with t(8;21) acute myeloid leukemia and contributes directly to its unique transcriptional signature. Leukemia. 2010; 24:950–57. https://doi.org/10.1038/leu.2010.61 [PubMed]
- 38. Kosuri KV, Wu X, Wang L, Villalona-Calero MA, Otterson GA. An epigenetic mechanism for capecitabine resistance in mesothelioma. Biochem Biophys Res Commun. 2010; 391:1465–70. https://doi.org/10.1016/j.bbrc.2009.12.095 [PubMed]