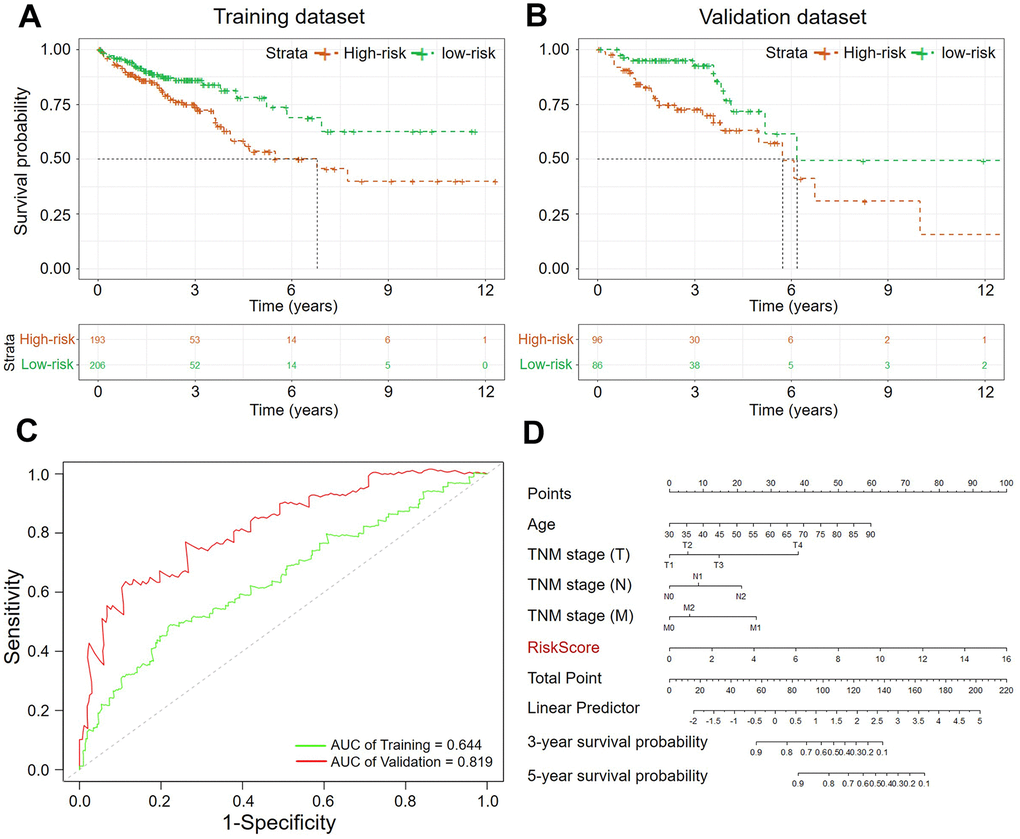
Figure 5.The Kaplan–Meier curves of the OS for high-risk and low-risk. (A) Training dataset (p-value < 0.005); (B) Validation dataset (p-value < 0.005); (C) ROC analysis of sensitivity and specificity (Green: Training dataset, Red: Validation dataset; (D) Nomogram of clinicopathological characteristics and RiskScore.