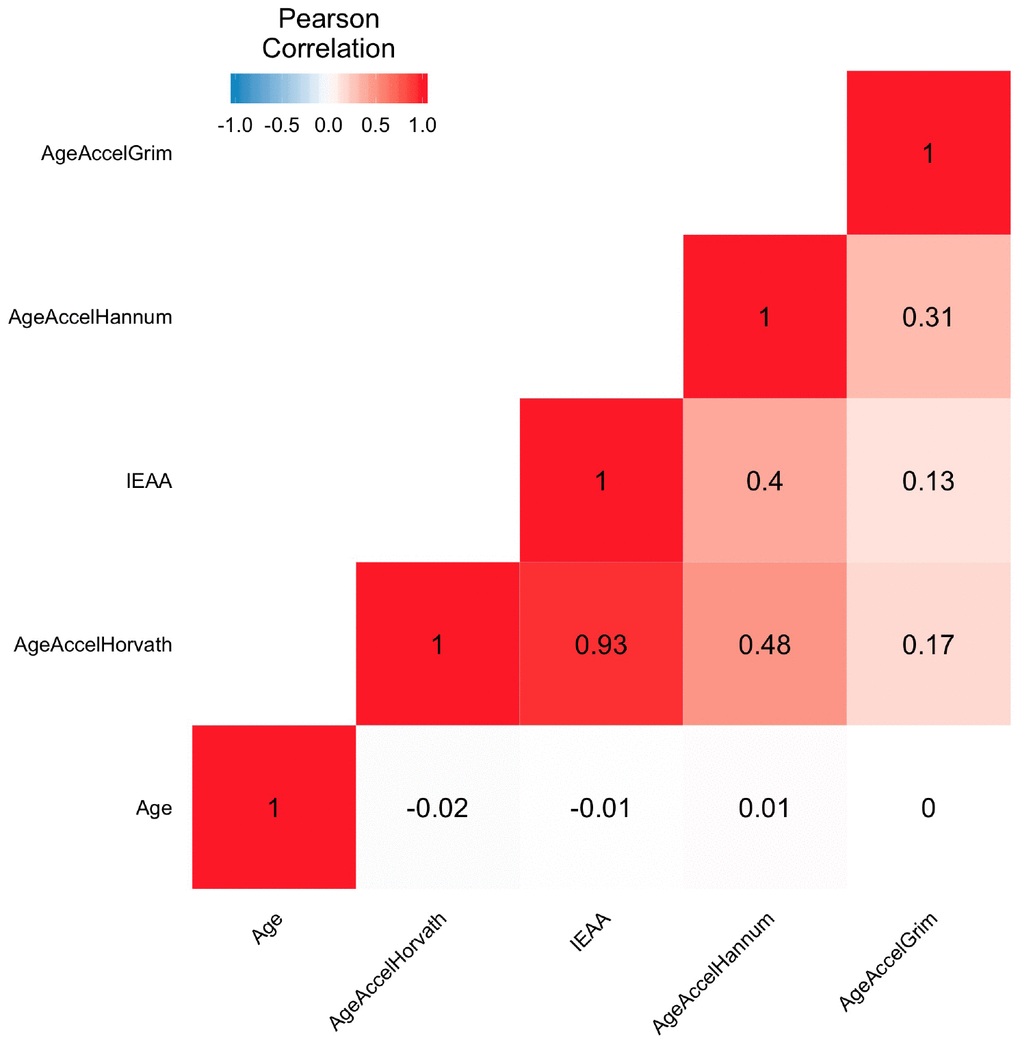
Figure 1.Heatmap of pairwise correlations of chronological age and epigenetic age accelerations. The heat map color-codes the pairwise Pearson correlations of chronological age and epigenetic age accelerations in the Framingham Heart Study (N=2326). Age represents the chronological age. AgeAccelHorvath, IEAA, AgeAccelHannum, and AgeAccelGrim represent measures of epigenetic age acceleration derived from the Horvath pan tissue clock, the intrinsic clock, the Hannum clock, and the GrimAge clock, respectively. The shades of color (blue, white, and red) visualize correlation values from -1 to 1. Each square reports a Pearson correlation coefficient.