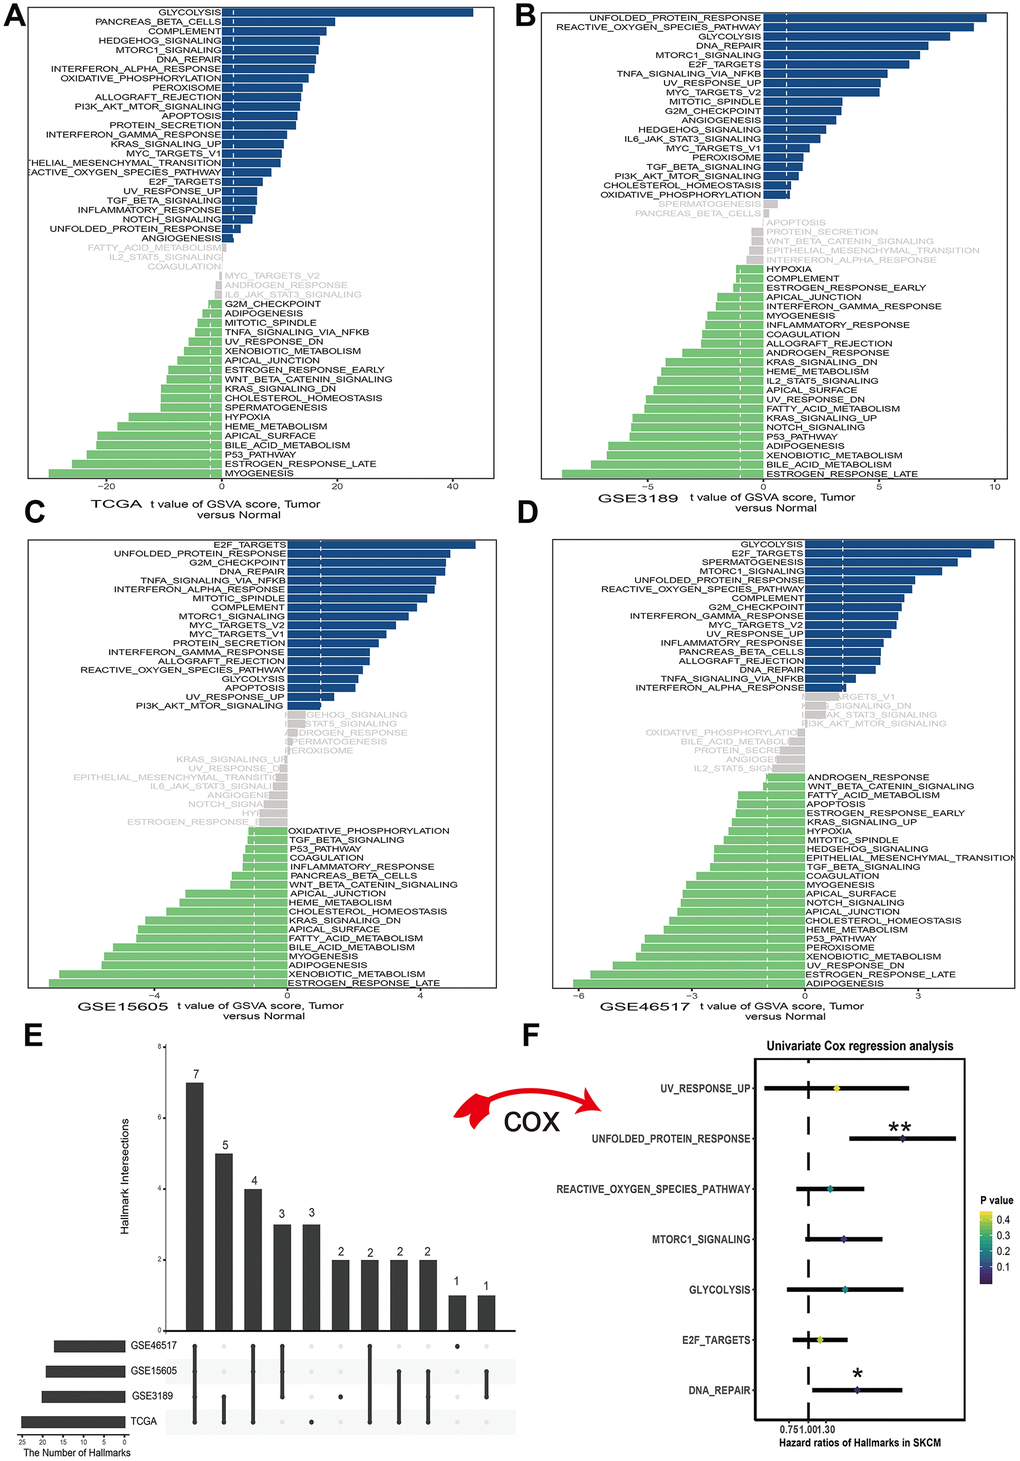
Figure 1.Differences in cancer hallmark pathway activities between melanoma and normal sample scored by GSVA method. (A) Cancer hallmark pathways in TCGA dataset. (B) Cancer hallmark pathways in GSE3189 dataset. (C) Cancer hallmark pathways in GSE15605 dataset. (D) Cancer hallmark pathways in GSE46516 dataset. The blue bars stand for the up-regulated pathways and the green bars mean down-regulated pathways. The x-axis is the t value of GSVA score. (E) Upset plot of different cancer hallmarks in multiple datasets. The dark bar on the left of drawing represents the amount of each dataset. The dark dots in the matrix at right of drawing represent the intersections of cancer hallmarks. (F) Forest plots of 7 cancer hallmarks, among which only unfolded protein response and DNA repair significantly correlated with OS (Overall survival) in TCGA dataset. *p<0.05; **p<0.01.