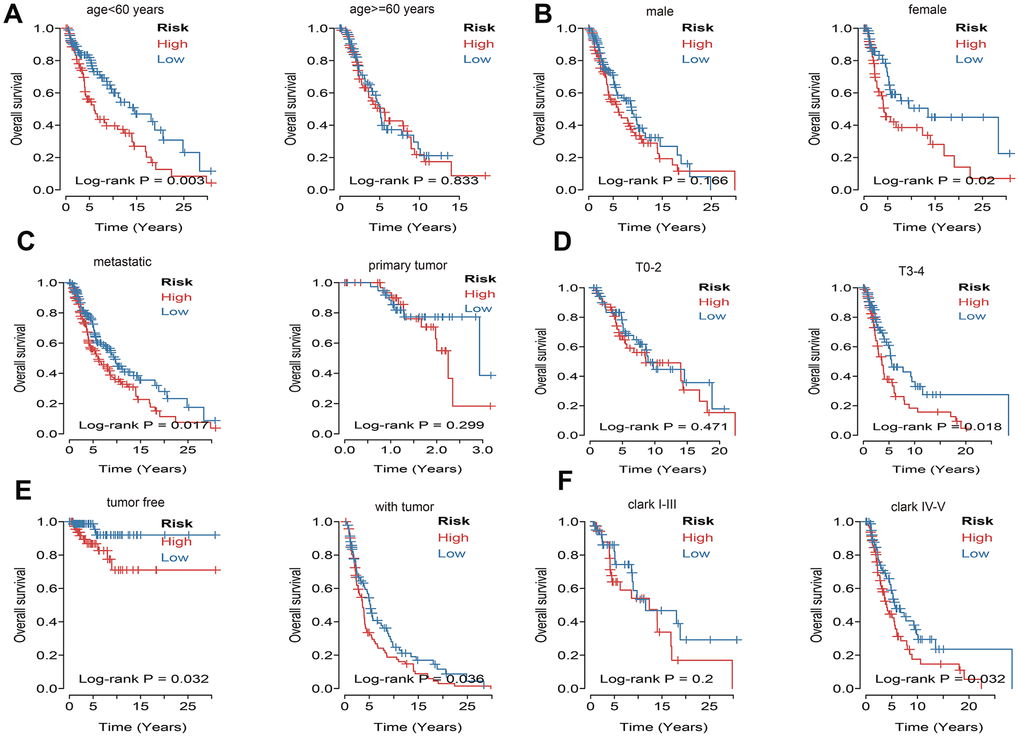
Figure 7.Kaplan–Meier curve illustrates the prognostic value of risk score signature based on subgroup of different clinical variables. (A) Tthe subgroup age. (B) The subgroup sex. (C) The subgroup of metastasis. (D) The subgroup tumor size. (E) The subgroup of tumor status. (F) The subgroup Clark level.