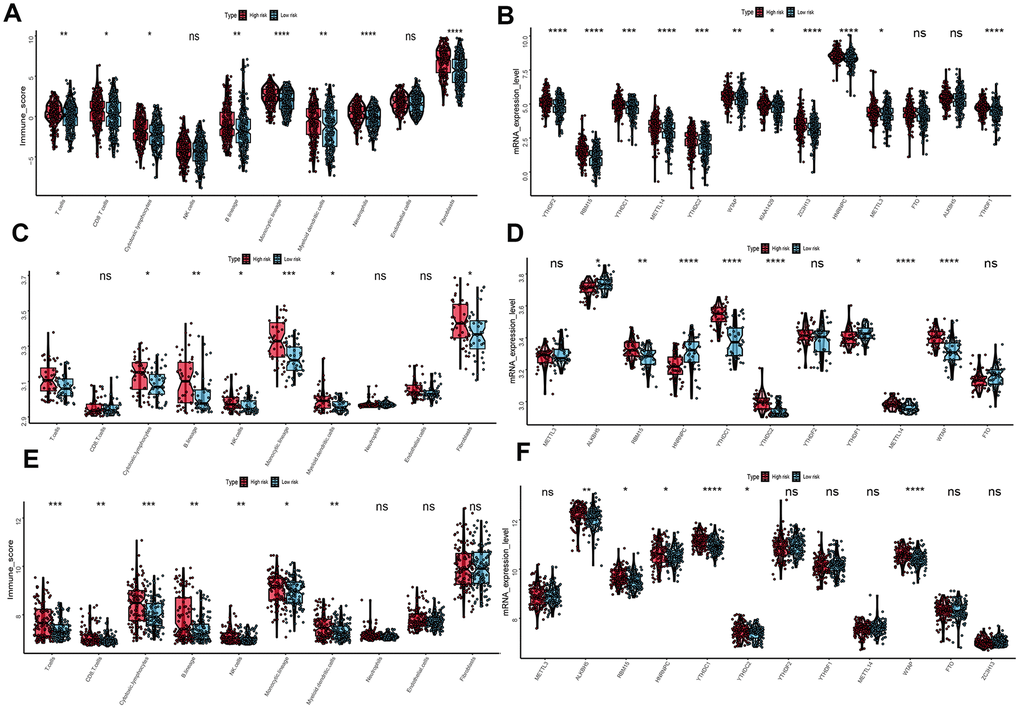
Figure 8.Immune microenvironment and m6A regulation between the high- and low-risk phenotype. (A) Difference immune score of 10 immune cells between the high- and low-risk melanoma patients in TCGA dataset. (B) Expression of N6-methyladenosine (m6A) RNA methylation regulators between the high- and low-risk melanoma patients in TCGA dataset. (C) Immune score distribution of 10 immune cells between the high- and low-risk group in GSE54467 dataset. (D) Different expression level of m6A regulators between the high- and low-risk group in GSE54467 dataset. (E) Immune score distribution of 10 immune cells between the high- and low-risk group in GSE65904 dataset. (F) Different expression level of m6A regulators between the high- and low-risk group in GSE65904 dataset. *p<0.05; **p<0.01;***p<0.001;****p<0.00001.