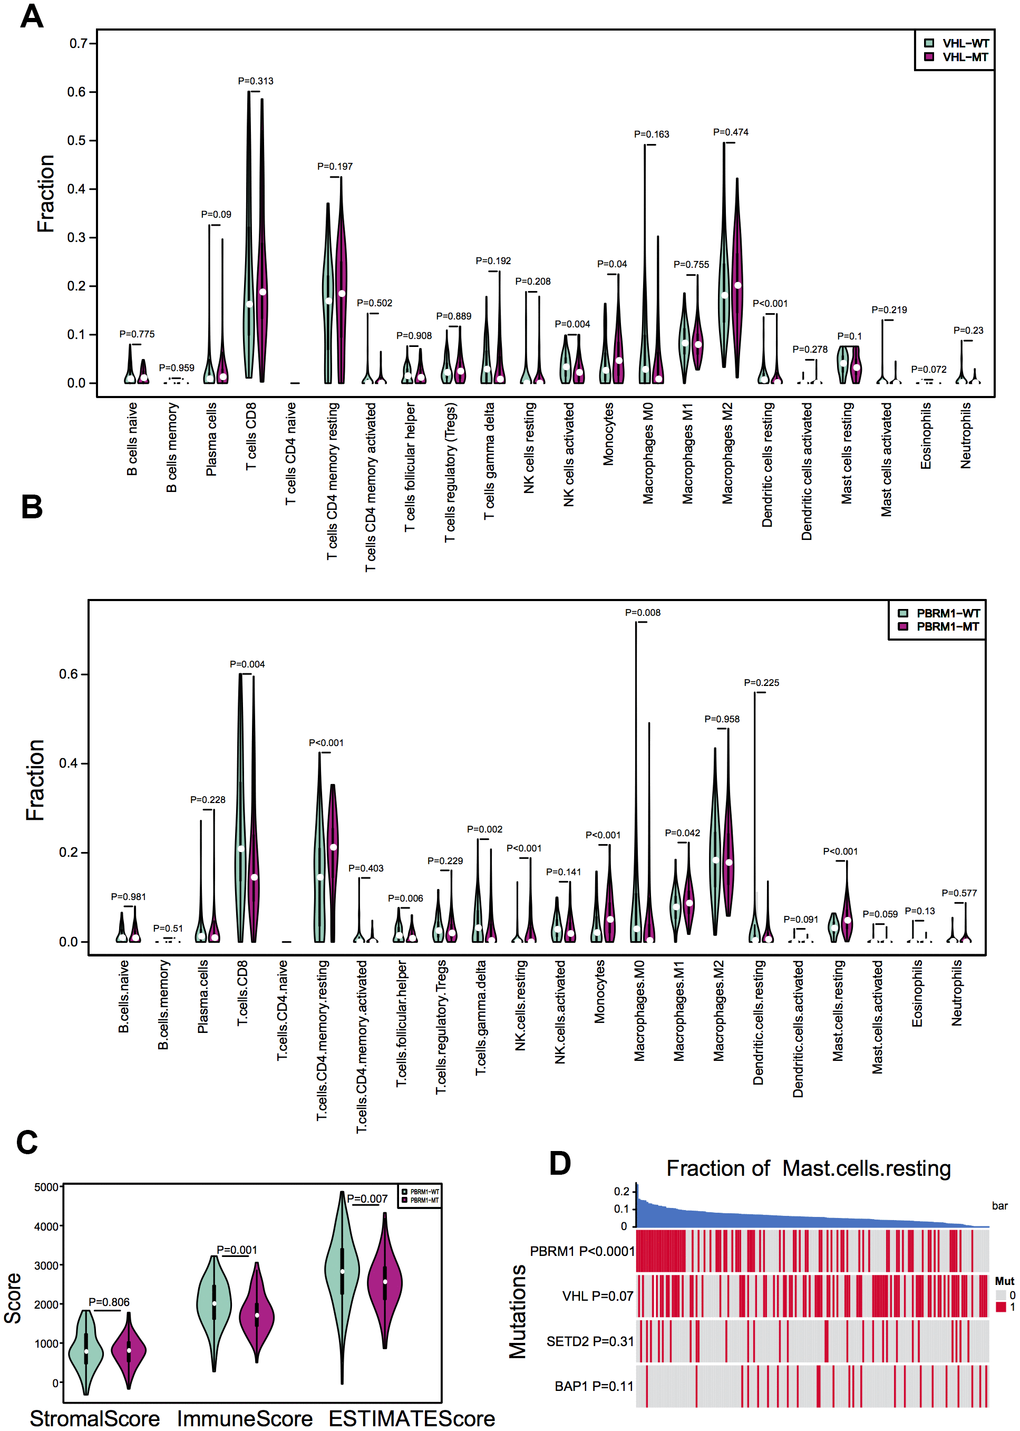
Figure 2.PBRM1 mutations alter immune cell infiltration patterns in ccRCC samples. (A) Violin plots show different patterns of immune cell infiltration patterns in VHLWT (90) and VHLMUT (94) patients from the TCGA KIRC database. (B) Violin plots show different immune cell infiltration patterns in PBRM1WT (97) and PBRM1MUT (81) patients from the TCGA KIRC database. (C) Violin plots show stromal and immune purity scores from the ESTIMATE algorithm analyses for PBRM1WT and PBRM1MUT patients in the TCGA KIRC database. (D) Heatmap shows the mast cell infiltration status in PBRM1MUT, VHLMUT, SETD2MUT and BAP1MUT ccRCC patients from the TCGA KIRC database.