


Introduction
According to the World Health Organization statistics in 2018, the incidence and mortality rates of kidney cancer were 4.5% and 2.0%, respectively, with 403,262 newly diagnosed cases and 175,098 deaths reported worldwide [1]. Clear-cell renal cell carcinoma (ccRCC) accounts for approximately 75% of all RCC cases [2]. The most commonly mutated gene in ccRCC is VHL (Von Hippel-Lindau), which encodes a tumor suppressor protein [2, 3]. Functional loss of VHL stabilizes the hypoxia-inducible factor (HIF) and activates the VEGF (vascular endothelial growth factor) and mTOR (mammalian target of rapamycin) signaling pathways [3, 4]. The standard therapy for ccRCC patients includes tyrosine kinase inhibitors targeting the VEGF signaling pathway, such as sunitinib and pazopanib, and mTOR kinase inhibitors, such as, everolimus and temsiromus [5, 6]. However, disease relapse is common in ccRCC patients treated with tyrosine kinase inhibitors or mTOR inhibitors [3]. Recent clinical trials with immune checkpoint inhibitors such as nivolumab and ipimumab demonstrate improved safety and robust antitumor activity in ccRCC patients [7–10]. Furthermore, differential clinical responses to treatment with tyrosine kinase inhibitors and immune checkpoint inhibitors suggest that VHL-independent mechanisms may influence tumor progression in ccRCC.
PBRM1 (Polybromo-1) gene is located on chromosome 3p21 and is the second most frequently mutated gene in ccRCC [11]. PBRM1 encodes a subunit of the nucleosome remodeling complex called polybromo-1 (PBRM1), also called as BAF180 or BRG1-associated factor 180 [12]. PBRM1 mutations that disrupt the nucleosome remodeling complex have been implicated in RCC, non-small cell lung cancer, and prostate cancer [12–16]. As far as we known, there is no consistent conclusion about PBRM1 mutations/PBRM1 low expression with ccRCC prognosis and immunotherapy response. In Kapur et al’s. report, limiting the sample size, follow-up, and patient populations, there was no conclusion whether PBRM1 are independent predictors of outcome in ccRCC [17]. In Hakimi et al’s. report, PBRM1 mutations also did not impact cancer-specific survival [18]. However, there were opposite reports claiming that loss of PBRM1 is associated with advanced tumor stage, low differentiation grade tumors, and worse patient survival outcomes [19–22]. The different results indicated the function of PBRM1 protein in ccRCC need further study. Moving forward, ccRCC tumors with PBRM1 mutations are associated with higher expression of angiogenetic genes [23]. PBRM1 mutations also correlate with outcomes in ccRCC patients treated with immune checkpoint inhibitors [24, 25]. However, there is extensive literature indicating the contrary. Xian-De et al. reported that PBRM1 mutations were associated with poor response to immune clinical response therapy in nearly 700 ccRCC patients [26]. However, Miao et al. reported that PBRM1 mutations were associated with better immune clinical response therapy in more than 100 ccRCC patients [25], and also in David et al’s. report, they revealed that PBRM1 mutations were associated with improved response, progression free survival and overall survival with PD-1 blockade in 592 patients with advanced ccRCC cohort [27]. Immune clinical response was affected by immune tumor microenvironment, but the mechanisms by which mutations in PBRM1 modulate the tumor microenvironment (TME) are still poorly understood, which need further study.
The TME includes fibroblasts, pericytes, endothelial cells, and immune cells such as T cells, mast cells, and macrophages [28–30]. Mast cells are one of the earliest cell types that infiltrate developing tumors [31]. They secrete several pro-angiogenic factors such as VEGF, basic fibroblast growth factor (bFGF), angiopoietin-1 (ANG-1), heparin, and tumor necrosis factor alpha or TNF-α [32]. They also secrete or express several chemokines and cytokines that modulate immune function such as interleukin 5 (IL-5), IL-6, MHC II (major histocompatibility complex, class II), and TNF-α [32, 33]. In ccRCC tissues, higher numbers of mast cells correlate with increased microvascular density [34–37]. Furthermore, mast cells, ccRCC cells, and endothelial cells interact via the SCF (stem cell factor)/c-Kit signaling pathway [38]. In ccRCC tissues, the status of VHL mutations do not correlate with the expression of immune cells [25], whereas, PBRM1 mutations are associated with T cell infiltration and immune-related gene expression [25]. However, the mechanistic details of the crosstalk between PBRM1 mutations in ccRCC cells, the tumor microenvironment, and immune cell infiltration and function is not clear.
In this study, we investigated mechanisms through which PBRM1-mutated (PBRM1MUT) ccRCC cells modulate the tumor micro-environment and tumor-infiltration of immune cells using gene expression data from ccRCC patients in the TCGA database and in vitro experiments using ccRCC cell lines.
Results
PBRM1MUT patients exhibit altered immune cell profiles in the tumor microenvironment
We analyzed the gene expression and mutation data of 178 ccRCC patients in the TCGA KIRC database to evaluate the relationship between mutations in VHL, PBRM1, BAP1, and SETD2 genes in the ccRCC tissues and the infiltration of 22 different immune cell types in the TME. We observed that VHL and PBRM1 were mutated in 47% and 40% of ccRCC patients (Supplementary Figure 1A). Among the 21 immune cell subpopulations (naïve CD4+- T cells were excluded), we observed higher proportions of resting mast cells and reduced numbers of resting memory CD4+ T cells, M2 macrophages, CD8+T cells, activated NK cells, and regulatory T cells and other immune cell types (Figure 1). Furthermore, analysis of immune cell profiles of ccRCC patients suggested immune suppression in PBRM1MUT ccRCC patients (Supplementary Figure 1B). These results show that PBRM1 mutation in the ccRCC cells promotes immune suppression and alters immune cell profiles in the TME.
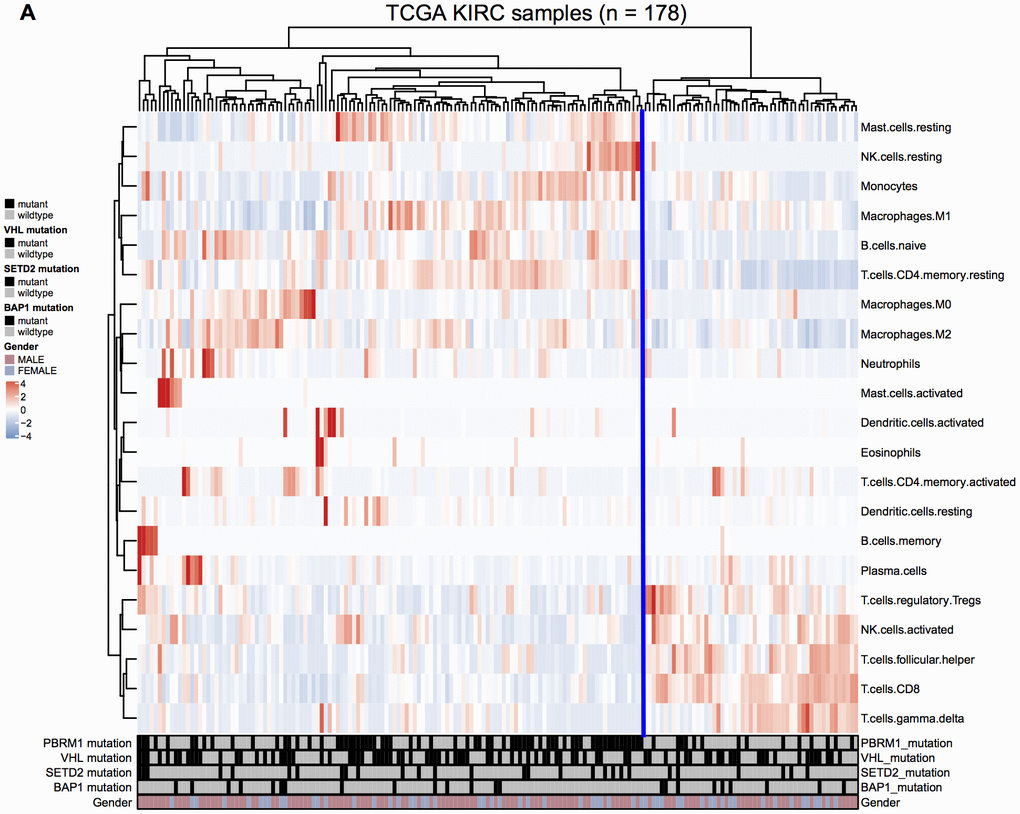
Figure 1. Immune cell landscape of ccRCC samples. (A) The distributions of twenty-two different immune cell types in the 178 ccRCC samples from the TCGA KIRC database are shown.
PBRM1MUT tissues show increased tumor purity and mast cell infiltration in the TME
We next evaluated the effects of mutations in VHL and PBRM1 genes on the infiltration of 22 different immune cell subpopulations in ccRCC tissues. The violin plots show the differences in the proportions of different immune cell populations in the VHLWT and VHLMUT as well as PBRM1WT and PBRM1MUT ccRCC patients (Figure 2A, 2B). The sample dendrograms are shown in Supplementary Figure 2 and Supplementary Figure 3. Our results observed that the proportion of different immune cell types was similar in VHLMUT and VHLWT ccRCC tumors (Figure 2A). However, PBRM1MUT ccRCC tissues showed lower proportions of CD8+ T cells (P=0.004) and activated CD4+ memory T cells (P=0.403), and significantly higher proportion of resting mast cells (P<0.001) compared to the PBRM1WT ccRCC tissues (Figure 2B), and other immune cell types in the ccRCC TME exhibited weak correlation with the PBRM1MUT genotype.
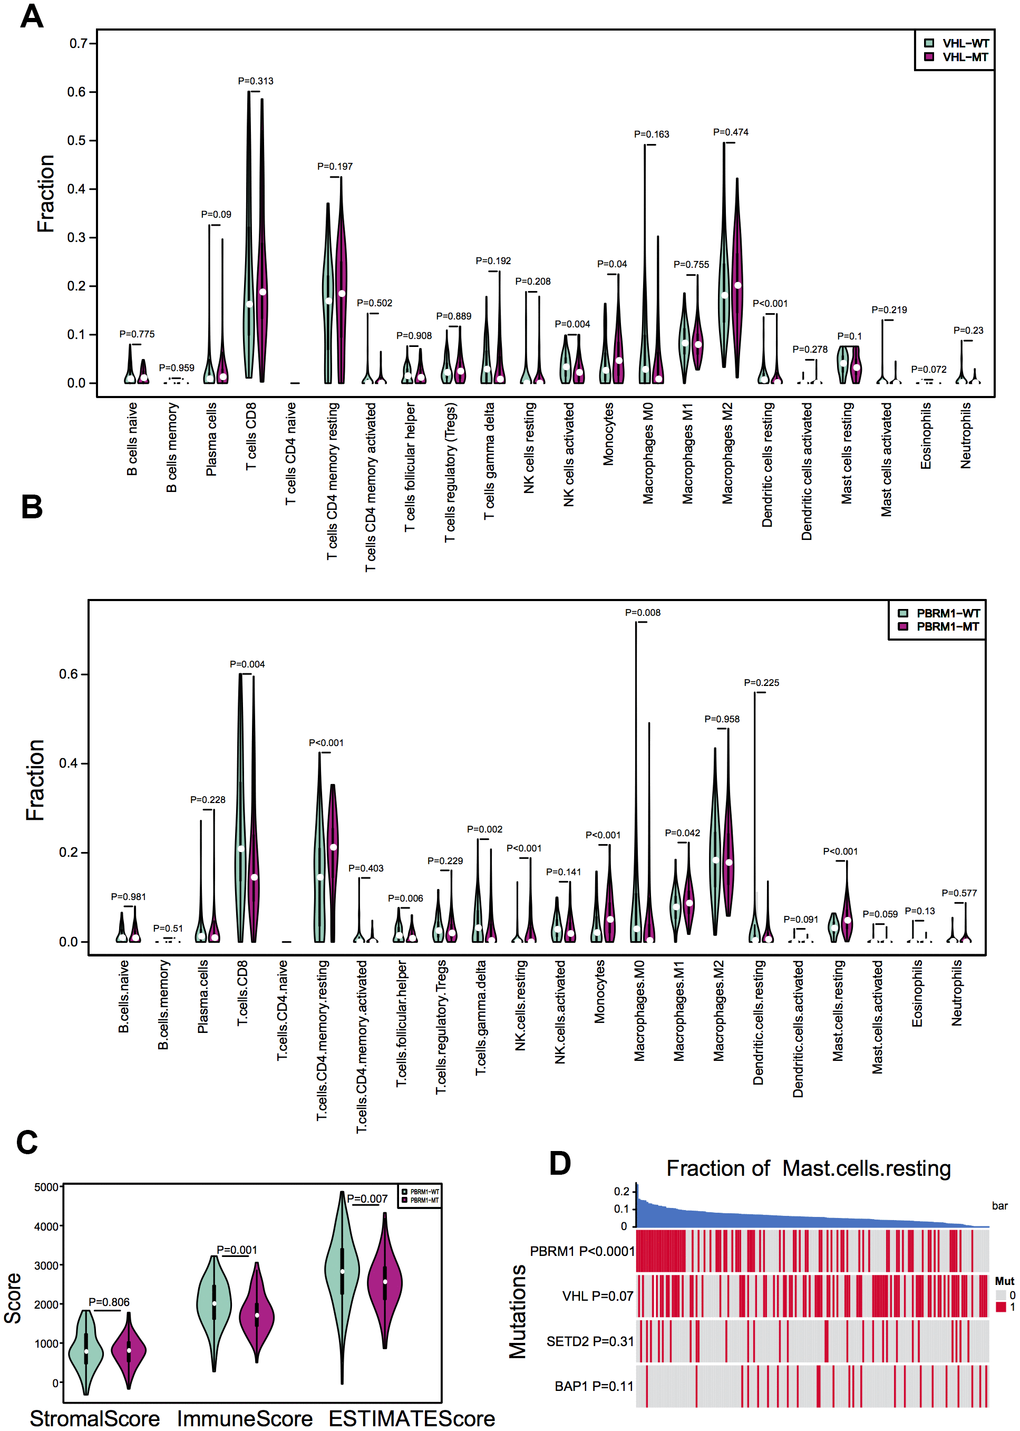
Figure 2. PBRM1 mutations alter immune cell infiltration patterns in ccRCC samples. (A) Violin plots show different patterns of immune cell infiltration patterns in VHLWT (90) and VHLMUT (94) patients from the TCGA KIRC database. (B) Violin plots show different immune cell infiltration patterns in PBRM1WT (97) and PBRM1MUT (81) patients from the TCGA KIRC database. (C) Violin plots show stromal and immune purity scores from the ESTIMATE algorithm analyses for PBRM1WT and PBRM1MUT patients in the TCGA KIRC database. (D) Heatmap shows the mast cell infiltration status in PBRM1MUT, VHLMUT, SETD2MUT and BAP1MUT ccRCC patients from the TCGA KIRC database.
The comprehensive understanding of infiltrating stromal and immune cells in tumour tissue not only perturb the tumour signal in molecular studies but also have an important role in cancer biology [39]. We assessed infiltrating stromal and immune cells in tumor tissues to predict tumor purity in PBRM1MUT ccRCC patients. As shown in Figure 2C, the PBRM1MUT ccRCC patients showed significantly lower immune scores (P=0.001) and ESTIMATE scores (P=0.007) based on ESTIMATE algorithm analyses compared to PBRM1WT ccRCC patients. Furthermore, resting mast cell recruitment positively correlated with the PBRM1MUT genotype (P<0.0001), but showed no significant correlation with mutations in the VHL (P=0.0731), SETD2 (SET domain containing 2; P=0.306), and BAP1 (BRCA1 associated protein 1; P=0.106) genes (Figure 2D). These results demonstrate that tumor purity and recruitment of resting mast cells to the TME is significantly higher in PBRM1MUT ccRCC patients compared to PBRM1WT, VHLMUT, SETD2MUT and BAP1MUT ccRCC patients.
PBRM1 mutated ccRCC tumors show higher infiltration of mast cells and activation of cell growth and tumor angiogenesis pathways
Hierarchical clustering analysis of the gene expression data of ccRCC samples in the TCGA database identified 28 gene modules (Figure 3A). This included two large modules (dark orange and green), 25 small modules, and another gray module that contains non-clustering genes. We then assessed the relationship between the gene cluster modules, immune cell types, and the mutant PBRM1 genotypes in ccRCC patients, we observed strong correlation between PBRM1MUT and the numbers of resting mast cells (Figure 3B). Analysis of the association between 27 gene cluster modules and 4 mutant genotypes (VHL, PBRM1, SETD2, and BAP1) in ccRCC patients showed strong correlation between six gene modules (dark-orange, white, medium purple3, yellow-green, green, and saddlebrown). Further verified that mast cell infiltration was positive with PBRM1MUT, not VHL, SETD2, and BAP1 mutation, respectively (Figure 3C). We also observed three modules (dark-orange, white, and green) were significantly with PBRM1MUT and mast cell infiltration (P<0.001, P<0.001, and P<0.001, respectively). Pathway analysis of the dark-orange and white modules showed that they contained genes played a role in the Notch, MAPK (mitogen-activated protein kinase), and TGF-β (transforming growth factor-β) signaling pathways, tyrosine kinases, and extracellular matrix organization (Figure 3D, 3E), this suggests that PBRM1MUT enhanced ccRCC progression though the Notch, MAPK, and TGF-β pathways. Furthermore, GSEA showed activation of FARDIN hypoxia signaling (red), MENSE hypoxia signaling (green), MIZUKAMI hypoxia signaling (green), PID-HIF1-THPATHWAY (purple), and PID-HIF2 PATHWAY (blue) in the PBRM1MUT ccRCC tumor samples (Figure 3F). FARDIN hypoxia signaling, MENSE hypoxia signaling, MIZUKAMI hypoxia signaling, PID-HIF1-THPATHWAY, and PID-HIF2 PATHWAY pathways were all predicted activation of hypoxia- and HIF-related signaling pathways in the PBRM1mut group of ccRCC patients. We further analyzed the expression of angiogenesis-related genes, such as, VEGFA, VEGFB, VEGFC, VCAM1 (vascular cell adhesion molecule 1), PDGFA (platelet derived growth factor A), and PDGFB (platelet derived growth factor B) in the GSE36895 and TCGA ccRCC patient cohorts. As shown in Table 1, PBRM1MUT patients in both cohorts showed significantly higher VEGFA, VEGFB, VEGFC, VCAM1, PDGFA, and PDGFB mRNA expression compared to the PBRM1WT patients. These results suggest that PBRM1 mutation promotes mast cell infiltration into the TME and activates HIF-related signaling pathways that drive growth and progression of ccRCC.
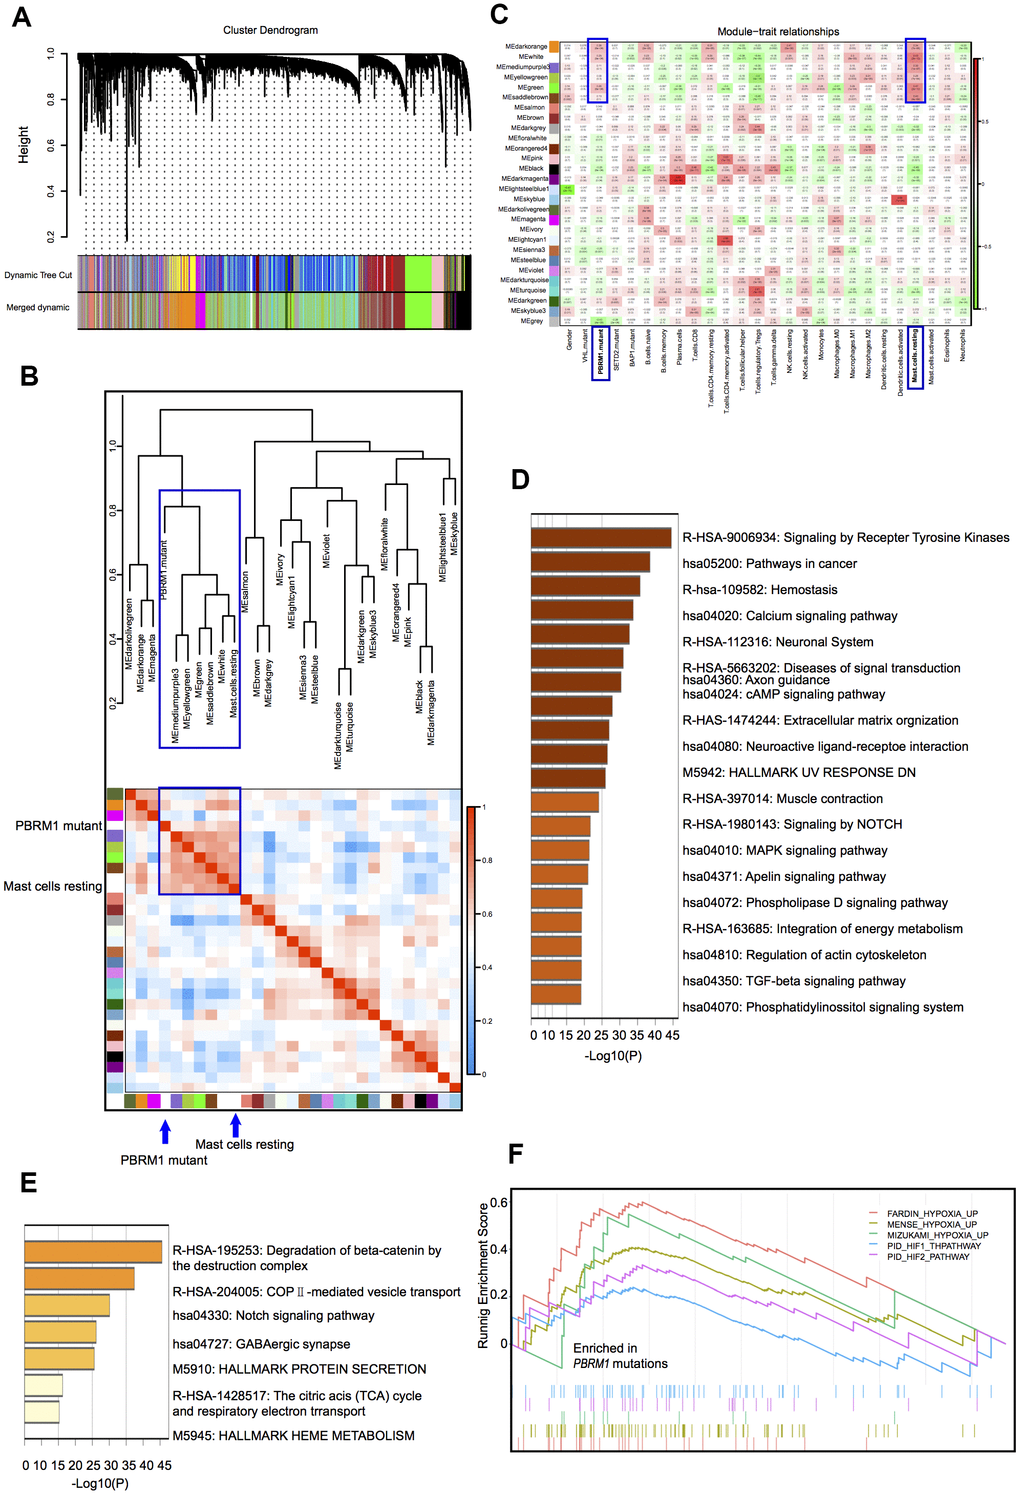
Figure 3. Correlation analyses between gene cluster modules, PBRM1 mutations, and mast cell infiltration in ccRCC patients. (A) The clustering dendrogram shows different gene cluster modules that are color-coded. The dissimilarity of genes is based on the topological overlap. (B) Heatmap shows the correlation between module eigengenes and immune cell infiltration in ccRCC samples. The correlation table is color-coded. The modules in the blue box are associated with PBRM1 mutations and mast cell infiltration. (C) Analysis of the association between the 27 gene cluster modules and the 4 mutant genotypes (VHL, PBRM1, SETD2, and BAP1) in ccRCC patients. Each cell represents a module correlation co-efficient and its corresponding p-value. (D) Pathway enrichment analysis of dark orange module. Dark orange gene cluster was positive with PBRM1 mutant and mast cell infiltration. (E) Pathway enrichment analysis of the white module. White gene cluster was positive with PBRM1 mutant and mast cell infiltration. (F) Enrichment plots show upregulated FARDIN hypoxia signaling (red), MENSE hypoxia signaling (green), MIZUKAMI hypoxia signaling (green), PID-HIF1-THPATHWAY (purple), PID-HIF2-PATHWAY (blue), and other gene sets in the PBRM1mut group of ccRCC patients. FARDIN hypoxia signaling gene set including the genes in the hypoxia signature, based on analysis of 11 neuroblastoma cell lines in hypoxia and normal oxygen conditions; MENSE hypoxia signaling gene set including hypoxia response genes up-regulated in both astrocytes and HeLa cell line; MIZUKAMI hypoxia signaling gene set including the genes up-regulated in colon cancer cells in response to hypoxia, might not be direct targets of HIF 1α; PID-HIF1-THPATHWAY gene set including the gens in HIF 1α transcription factor network; PID-HIF2-PATHWAY gene set including the gens in HIF 2α transcription factor network.
Table 1. Angiogenesis-related genes were upregulated in PBRM1MUT patients in 2 cohorts.
| GSE36895 | TCGA | |||
| PBRM1MUT (13)/PBRM1WT (16) | PBRM1MUT (131)/PBRM1WT (177) | |||
| Fold change | p value | Fold change | p value | |
| VEGFA | 1.27 | 0.14 | 1.14 | 0.04 |
| VEGFB | 1.21 | 0.23 | 1.12 | 0.01 |
| VEGFC | 1.12 | 0.65 | 1.01 | 0.84 |
| VCAM1 | 2.00 | 0.03 | 1.00 | 1.00 |
| PDGFA | 1.36 | 0.06 | 1.10 | 0.07 |
| PDGFB | 1.01 | 0.80 | 1.10 | 0.08 |
Low PBRM1 protein expression is associated with increased infiltration of mast cells
Next, we analyzed the association between PBRM1 protein levels and mast cell infiltration in ccRCC tumor samples. Immunohistochemical analysis (IHC) of 90 ccRCC and adjacent normal kidney tissues using anti-PBRM1 and anti-Tryptase (specific marker of mast cells) antibodies showed that PBRM1 protein expression was significantly reduced in the ccRCC tissues compared to the adjacent kidney tissues (Figure 4A, 4B, P<0.001). Moreover, as shown in Figure 4A, normal kidney tissues were PBRM1-positive and Tryptase-negative (no mast cells in normal tissue), whereas, ccRCC tumor tissues were PBRM1-negative and Tryptase-positive (high numbers of mast cells in the tumor). Furthermore, 65 out of 85 (76.4%) ccRCC patients that were PBRM1-negative showed worse overall survival than the remaining PBRM1-positive ccRCC patients (Figure 4C), however, there was no statistically significant between two groups (P=0.07). Moreover, tumor tissues from PBRM1-negative ccRCC patients showed significantly higher mast cell infiltration compared to those from PBRM1-positive ccRCC patients (Figure 4A, 4D). To confirm the effects of PBRM1 on mast cell recruitment, we performed an in vitro Transwell migration assays using 5×10⁴ HMC-1 cells in the upper chamber and PBRM1-knockdown ccRCC cells (786-O and Caki-1, Figure 5A, 4B) or conditioned media from these cells in the lower chamber. The results of the co-culture Transwell migration assay showed that HMC-1 recruitment was significantly higher in PBRM1-silenced 786-O- (siPBRM1-1, P=0.003; siPBRM1-2, P=0.006) and PBRM1-silenced Caki-1 (siPBRM1-1, P=0.002; siPBRM1-2, P=0.004) cells compared to their corresponding siNC-transfected controls (Figure 5C). Furthermore, HMC-1 recruitment was significantly higher in conditioned media derived from the PBRM1-silenced 786-O (siPBRM1-1, P=0.007; siPBRM1-2, P=0.005) and PBRM1-silenced Caki-1 (siPBRM1-1, P=0.001; siPBRM1-2, P=0.001) cells compared to CM derived from siNC-transfected controls (Figure 5D). These data confirm that PBRM1 downregulation in ccRCC cells promotes recruitment of mast cells, both in vivo and in vitro.
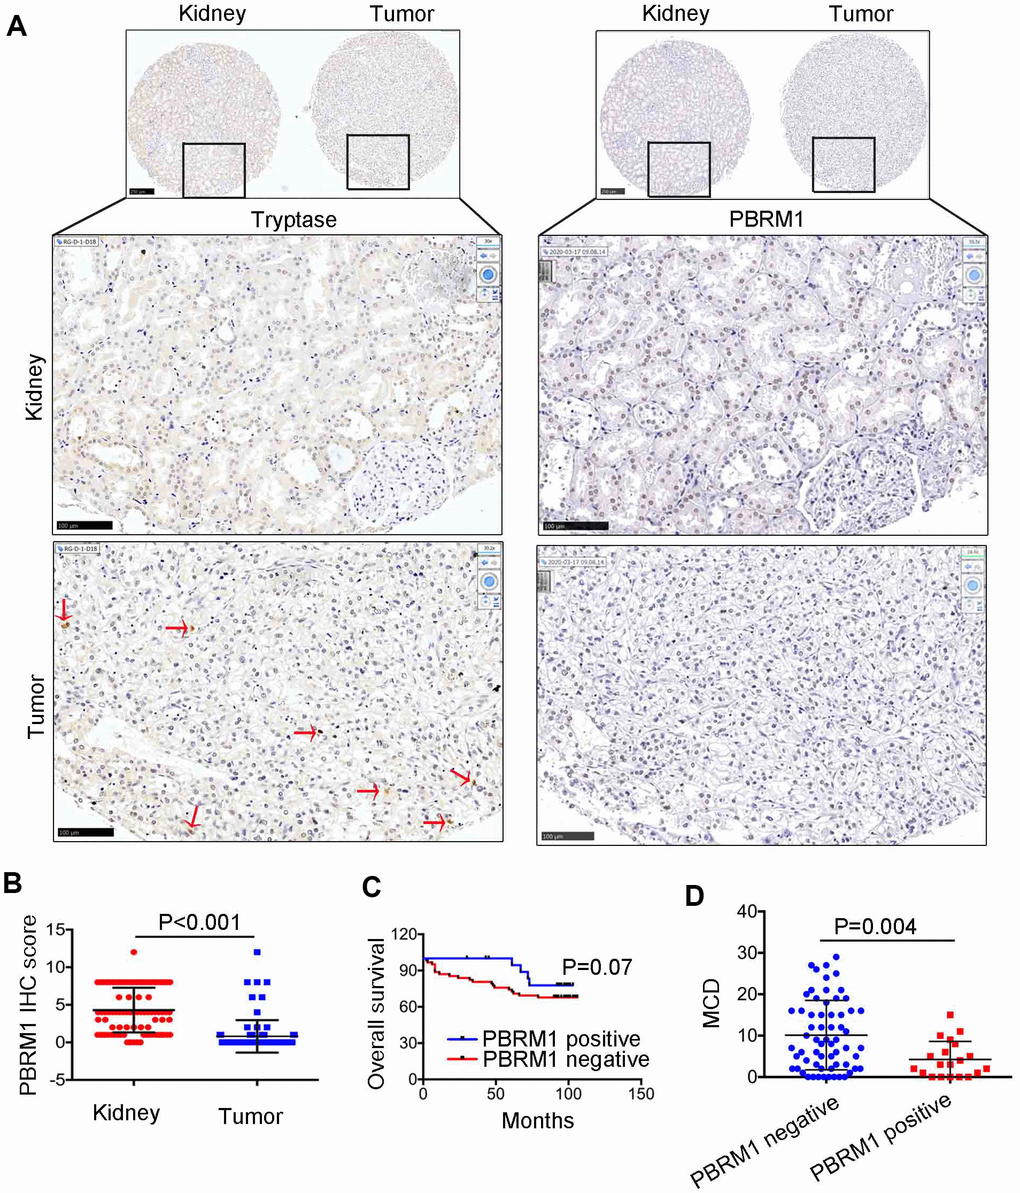
Figure 4. The relationship between PBRM1 protein expression and mast cell infiltration in ccRCC based on IHC analysis. (A) Representative immunohistochemical images show PBRM1- and tryptase-positive mast cells in ccRCC and adjacent normal kidney tissue samples. (B) Dot plot of PBRM1 IHC staining score in adjacent normal kidney tissues (n=83) and ccRCC tissues (n=83). (C) Overall survival of ccRCC patients with PBRM1 IHC staining negative group (n=65) or PBRM1 IHC staining positive group (n=20). (D) Pearson correlation analysis shows the association between PBRM1 expression and mast cell infiltration in 85 out of 90 ccRCC patient tumor tissue samples. Data for five tumor tissues is not included (missing the tissues in TMA). Note: Statistical significance was based on Student’s t-test.
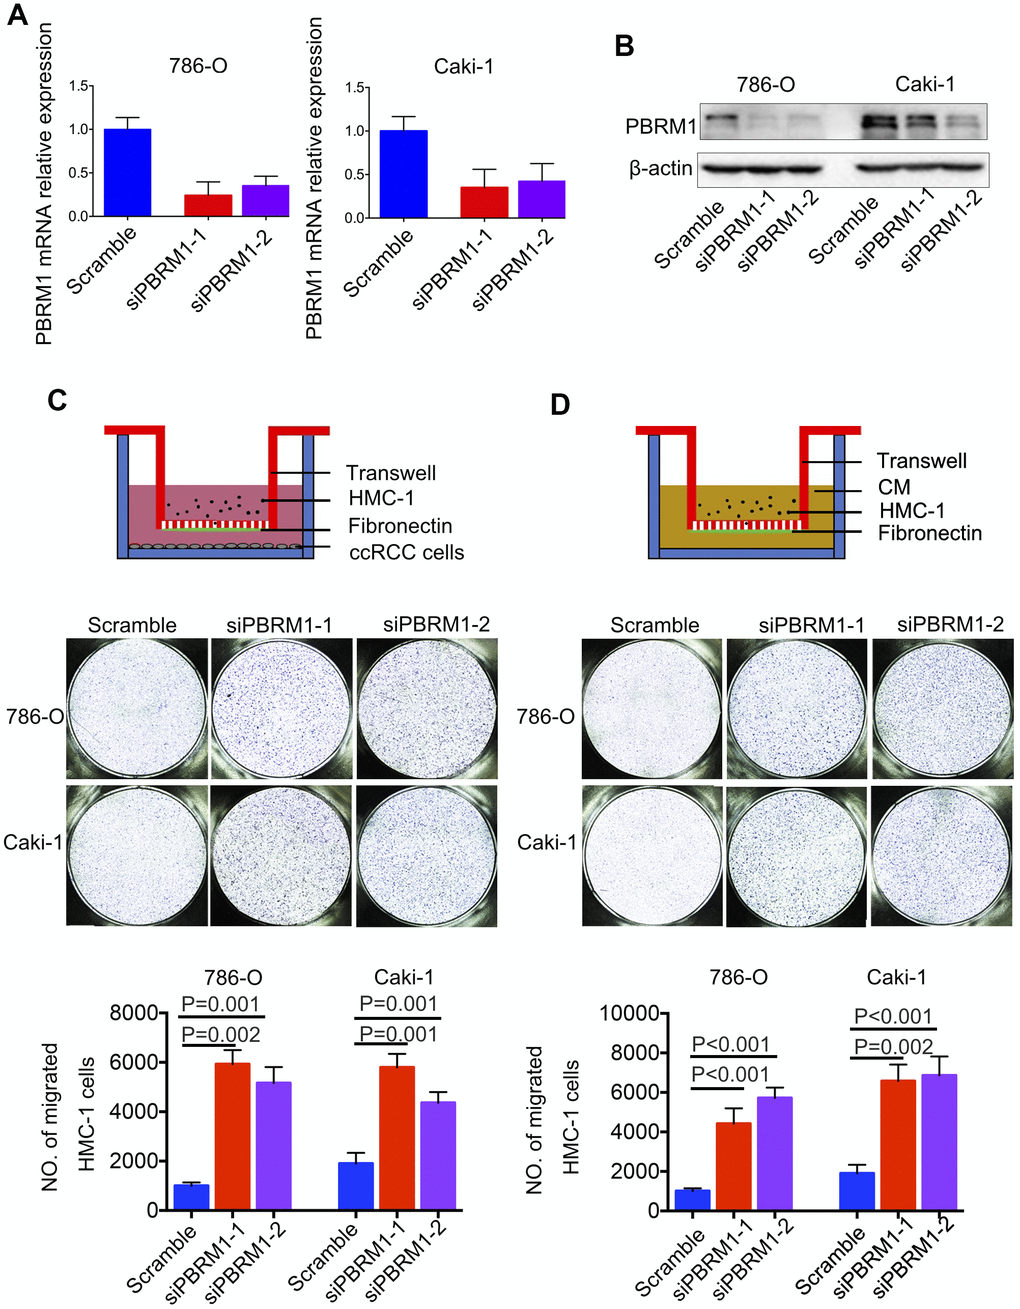
Figure 5. PBRM1-silenced ccRCC cells recruit significantly higher numbers of mast cells in vitro. (A) qRT-PCR and (B) Western blot analysis shows PBRM1 mRNA and protein levels in control and PBRM1-silenced 786-O and Caki-1 cells. (C, D) Transwell migration assay results show the total numbers of migrating HMC-1 cells when co-cultured with control and PBRM1-silenced 786-O and Caki-1 cells or the conditioned media from these cells. The migrating HMC-1 cells are stained with crystal violet and counted. The experiments were performed in triplicate and the results are shown as means±SD. Student’s t-test was used to determine statistical significance.
PBRM1 silencing enhances tumor angiogenesis and ccRCC cell proliferation in vitro
Next, we performed tube formation matrigel assay to determine the effects of PBRM1-knockdown in ccRCC cells on tumor angiogenesis. The tube formation assay results showed that PBRM1-silenced 786-O (P=0.0067) and PBRM1-silenced Caki-1 (P=0.0034) cells formed higher numbers of tube-like structures compared to the corresponding controls (Figure 6A and Supplementary Figure 4A).
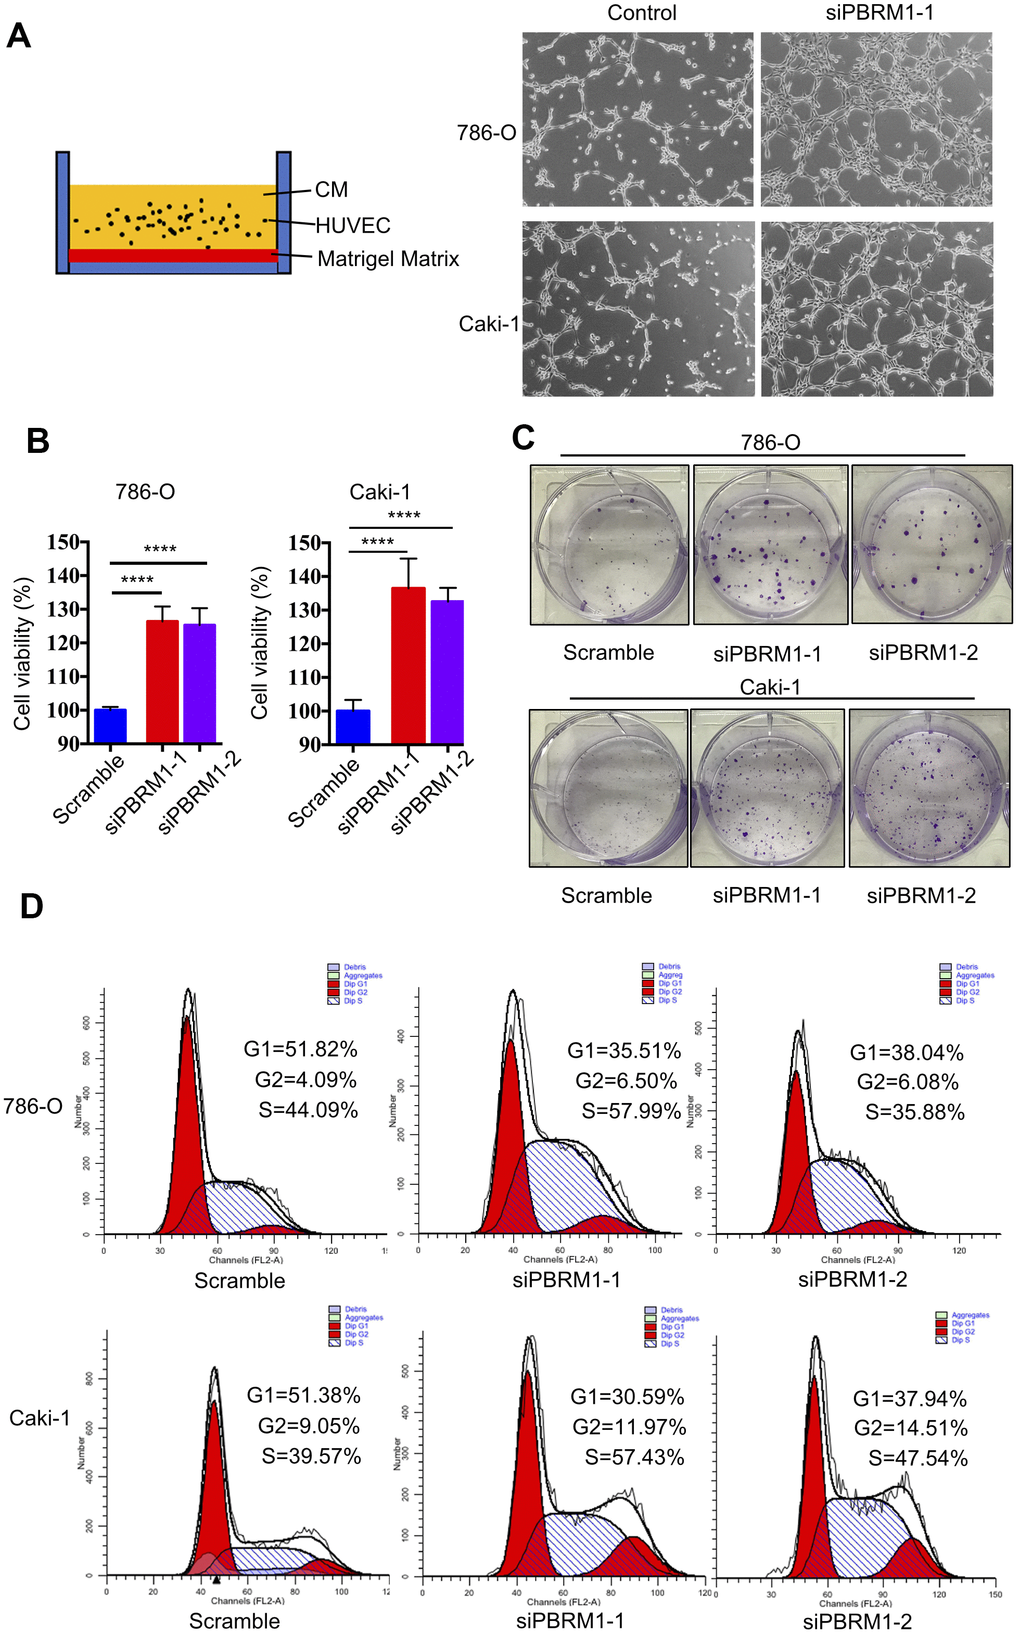
Figure 6. PBRM1 silencing enhances tumor angiogenesis and promotes cell proliferation of RCC cells in vitro. (A) Matrigel tube formation assay results show the tube-like structures formed in the matrigel by CM from control and PBRM1-silenced 786-O and Caki-1 cells. (B) MTT assay results show viability of control and PBRM1-silenced 786-O and Caki-1 cells. (C) The colony formation assay results show the total numbers of colonies formed by control and PBRM1-silenced 786-O and Caki-1 cells based on crystal violet staining. (D) Flow cytometry analysis shows the percentage of G1, S, and G2-M cells in control and PBRM1-silenced 786-O and Caki-1 cells based on PI staining. Note: The experiments were performed in triplicate and data are represented as means±SD; the statistical analysis was performed using Student’s t-test.
We also verified the results of PBRM1 suppression ccRCC cell growth in Varela et al. report [13]. The cell growth rate and colony formation ability was significantly higher in the PBRM1-knockdown 786-O and Caki-1 cells compared to the corresponding controls (Figure 6B, 6C and Supplementary Figure 4B). Furthermore, the proportion of G1-phase cells were significantly reduced in the PBRM1-knockdown 786-O and Caki-1 cells compared to the siNC-transfected 786-O and Caki-1 cells (786-O: 51.82% for control vs. 35.51% for siPBRM1-1 and 38.04% for siPBRM1-2; Caki-1: 51.38% for control vs. 30.59% for siPBRM1-1 and 37.94% for siPBRM1-2; Figure 6D). This suggests that PBRM1 silencing enhances G1-S transition of ccRCC cells, thereby increasing cell proliferation. Overall, these results demonstrate that PBRM1 silencing enhances angiogenesis and ccRCC cell proliferation.
PBRM1 silencing promotes mast cell recruitment involving upregulated CCL5 in the ccRCC tumor microenvironment
We next sought to understand the molecular mechanisms through which PBRM1-silenced ccRCC cells promote infiltration of mast cells. Pathway analysis showed that the inflammatory response signaling pathway was suppressed in PBRM1-overexpression Caki-2 cells (P<0.001, GSE76199; Supplementary Figure 5). Moreover, CCL5, the mast cell chemoattractant cytokine, was down-regulated in PBRM1-overexpression Caki-2 cells, and also CCL5 is one of the genes listed in the inflammatory response pathway (Figure 7A). qRT-PCR analysis showed that CCL5 mRNA levels were significantly upregulated in PBRM1-silenced 786-O and Caki-1 cells compared to the corresponding controls (Figure 7B). Moreover, ELISA assay results showed that CCL5 protein levels were significantly higher in the conditioned media of PBRM1-silenced ccRCC cells compared to the conditioned media of the controls (786-O: P=0.04; Caki-1: P=0.02; Figure 7C).
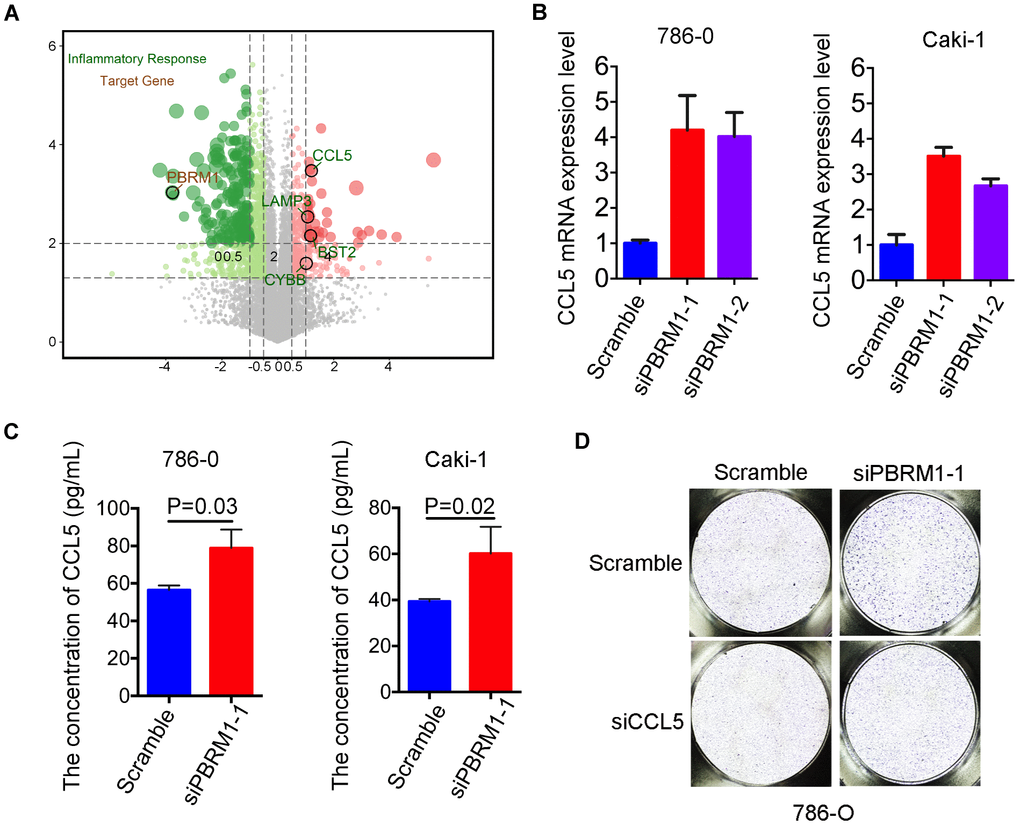
Figure 7. High CCL5 expression and secretion correlates with mast cell infiltration in PBRM1MUTccRCC cells and patients. (A) Volcano plot shows fold changes in gene expression in control and PBRM1-overexpressing Caki-2 cells. The association of immune response with mutations in PBRM1, VHL, SETD2 and BAP1 genes is shown in black circles. (B) qRT-PCR analysis shows CCL5 mRNA expression in 786-O- and Caki-1-silenced PBRM1 cells. (C) ELISA assay results show CCL5 levels in the conditioned media of control and PBRM1-silenced 786-O and Caki-1 cells using the human CCL5 ELISA kit. (D) Transwell migration assay results show total numbers of migrating HMC-1 cells when co-cultured with conditioned media derived from control, PBRM1-silenced and PBRM1-silenced plus CCL5-silenced 786-O cells. The migrating MHC-1 cells were stained with crystal violet and counted. Note: All experiments were performed in triplicate and are presented as means±SD; statistical analysis was performed using Student’s t-test.
In order to further examine the biological function of CCL5 on mast cell recruitment in renal carcinoma, CCL5 was knocked down in 786-O and Caki-1 (Supplementary Figure 4C). Transwell migration assay showed that the numbers of migratory HMC-1 cells were decreased when co-cultured with conditioned media of CCL5-silenced cells compared to the conditioned media of control cells in 786-O and Caki-1 cells, respectively (Supplementary Figure 4D, 4E). Furthermore, we constructed CCL5 knockdown in PBRM1-silenced ccRCC cells. As we expected, the numbers of migratory HMC-1 cells were significantly higher when co-cultured with conditioned media of PBRM1-silenced 786-O cells compared to the conditioned media of control 786-O cells (Figure 7D, Supplementary Figure 4F, P=0.002). Furthermore, CCL5 knockdown in PBRM1-silenced 786-O cells reversed the migration of HMC-1 cells through the transwell membrane compared to PBRM1-silenced 786-O cells (Figure 7D and Supplementary Figure 4F). CCL5 knockdown inhibited the numbers of migratory HMC-1 cells were also verified in PBRM1-silenced Caki-1 cells (Supplementary Figure 4G, 4H). These data show that PBRM1-silenced ccRCC cells produce significantly higher levels of CCL5, and CCL5 was involved in promoting recruitment of mast cells.
High CCL5 expression is associated with adverse survival outcomes in ccRCC patients
Next, we analyzed the relationship between CCL5 expression and ccRCC prognosis. Survival analysis showed that ccRCC patients with high CCL5 expression (CCL5High) were associated with worse survival outcomes than those with low CCL5 expression (CCL5Low; Figure 8A; P=0.004). Moreover, PBRM1High/CCL5Low ccRCC patients exhibited better overall survival than PBRM1High/CCL5High, PBRM1Low/CCL5High, and PBRM1Low/CCL5High ccRCC patients (Figure 8B). Furthermore, the hazard ratios (HR) of ccRCC patients with PBRM1High/CCL5High, PBRM1Low/CCL5High, and PBRM1Low/CCL5High were 2.866 (P<0.001), 3.661 (P<0.0001), and 3.146 (P<0.001) higher than the HR of ccRCC patients with PBRM1High/CCL5Low expression (Figure 8B). As shown in Figure 8C, CCL5high ccRCC patients showed significant enrichment in immune-related signaling pathways, including inflammatory signaling (P=0.0103), IFN-γ signaling (P=0.0103), IFN-α signaling (P=0.002), IL-6-JAK-STAT3 (P=0.0018), and TNF-α-NF-ΚB signaling (P=0.0103).
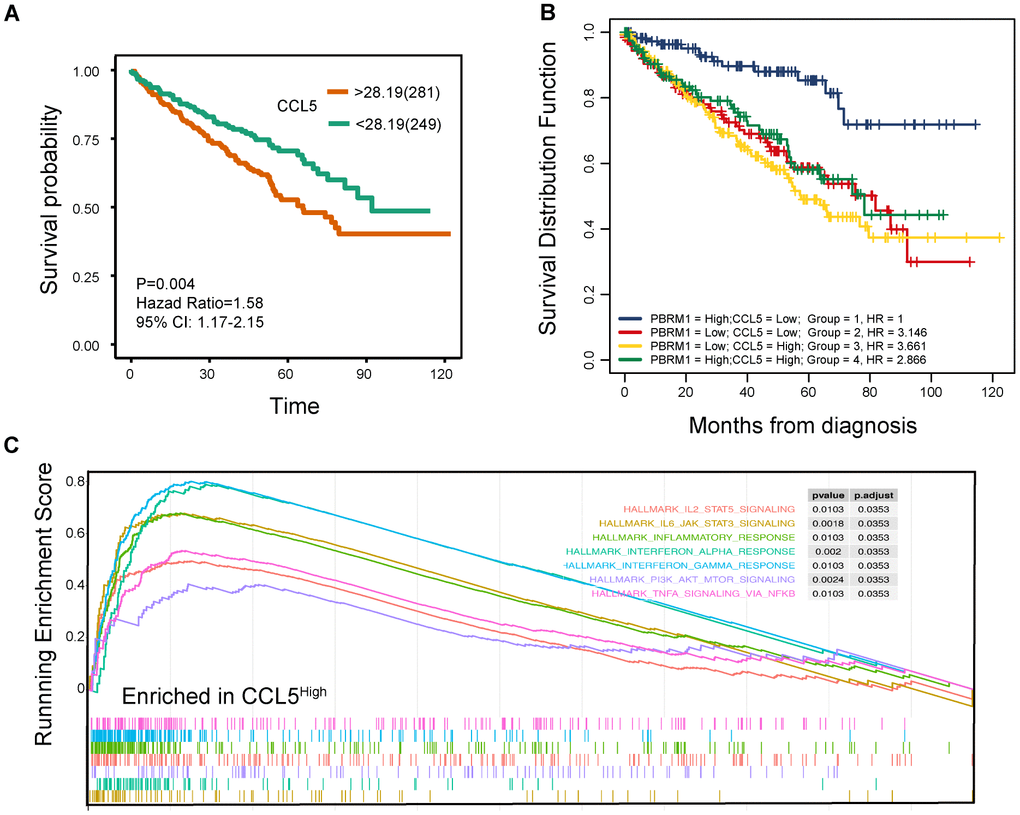
Figure 8. High CCL5 expression is associated with immune suppression and adverse survival outcomes in ccRCC. (A) The overall survival (OS) of high- and low-CCL5 expressing ccRCC patients in the TCGA KIRC database as evaluated by the survival and survminer packages is shown. P<0.05 is considered statistically significant. (B) The overall survival of ccRCC patients in the TCGA KIRC database according to high- and low- PBRM1 and CCL5 expression using survminer packages, log-rank tests, and COX regression analysis. (C) Enrichment plots show the status of gene sets belonging to IL6/JAK/STAT3 signaling (yellow), IL2/STAT5 (red), the inflammatory response (green), the IFN-α response (light blue), the IFN-γ response (blue), PI3K/AKT/MTOR signaling (purple), and TNF-α/NFΚB signaling (light red) pathways in the CCL5High group of ccRCC patients.
We also evaluated the clinical significance of IFN-γ expression in ccRCC patients. Survival analysis showed that low IFN-γ-expressing ccRCC patients (IFN-γLow) showed better outcomes than IFN-γHigh ccRCC patients (P=0.004; Supplementary Figure 6A). Moreover, CCL5Low/IFN-γLow ccRCC patients showed better overall survival than CCL5High/IFN-γLow, CCL5Low/IFN- γHigh, and CCL5High/IFN-γHigh ccRCC patients (Supplementary Figure 6B). Furthermore, PBRM1High/IFN-γLow ccRCC patients showed better overall survival than PBRM1Low/IFN-γLow PBRM1High/IFN-γHigh and PBRM1Low/IFN-γHigh ccRCC patients (Supplementary Figure 6C). Overall, our results confirm that high CCL5 expression promotes immune suppression and is positively associated with adverse outcomes in ccRCC patients.
Discussion
Patients with metastatic ccRCC are associated with poor prognosis because of a high frequency of drug resistance. Hence, several studies are investigating the mechanisms that regulate ccRCC progression in order to identify new therapeutic targets [40–42]. Drugs that target aberrantly upregulated VEGF and mTOR signaling pathways because of VHL mutations show limited antitumor activity in ccRCC patients [6]. Previous studies show that PBRM1 modulates ccRCC progression and immunotherapy response [25, 43], but, the mechanisms are not clear. In this study, we demonstrate that PBRM1MUT ccRCC tumors overexpress VEGF and related proteins and activate HIF-related signaling pathways. Furthermore, PBRM1MUT ccRCC tumors recruit significantly higher numbers of mast cells into the tumor microenvironment, and CCL5 was upregulated in siPBRM1 cells, suggesting that mast cells were recruited by CCL5.
We also demonstrate that the infiltration of 22 different types of immune cells into the tumor microenvironment is dependent on the status of PBRM1 mutations (Figure 2B, 2D) and independent of VHL mutations (Figure 2A). This is consistent with the findings of Miao et al. who reported that the expression of immune-related factors such as IFNγ, CD8α, CD47, and IL10 are associated with PBRM1 mutations, but independent of VHL mutation status [25]. Deng et al. showed that PBRM1 deficiency increases the numbers of M2-like macrophages and dendritic cells in the tumor micro-environment [24]. Together, these results demonstrate that PBRM1 promotes ccRCC progression by modulating immune cell infiltration.
Analysis of the ccRCC TCGA datasets demonstrate that the numbers of CD8+T cells are significantly reduced in PBRM1MUT ccRCC patients (Figure 2B). Moreover, PBRM1MUT ccRCC tumors are associated with lower immunoscores (P=0.001) and ESTIMATES scores (P=0.007; Figure 2C), indicated PBRM1 mutation predicted worse response to PD-1 blockade. However, a study by Miao et al. showed that PBRM1 deficiency is associated with intermediate (n=17) or significant (n=27) response to anti-PD-L1 therapy in a cohort of 63 ccRCC patients, thereby contradicting with our findings [25]. Moreover, 25 of these 44 (57%) patients had an intact PBRM1 gene, with nonsense mutations in 5 patients. Miao’s study was consistent with David’s report, which identified that CD8+T cell infiltrated tumors are relatively depleted for PBRM1 mutations, and CD8+T cell infiltration by itself is not associated with response to anti-PD-1 [27]. Taken together, these contradictory results suggest that further multicenter large cohort studies are required to assess the relationship between PBRM1 mutation status and clinical benefit from immune therapy in ccRCC patients.
The study by Miao et al. also showed that IL-6-JAK-STAT3, TNF-α, and IFN-γ pathways were activated in PBRM1 deficient patients; upregulation of the IFN-γ signaling pathway increased the surface expression of PD-L1, which was the target of anti-PD-L1 therapy [25]. Our study also shows that the immune-related interferon, IFN-γ, and IL-6-JAK-STAT3 signaling pathways were all activated in PBRM1MUT ccRCC tumor tissues (Figure 8C). However, in David’s study, they found PBRM1 alterations were associated with lower IL6–JAK–STAT3 signaling [27].
In our study, we performed IHC as a ‘gold standard’ approach to test the relationship between PD-L1 expression and PBRM1 expression. 90 ccRCC tumor samples in a tissue array and found no correlation between PBRM1 and PD-L1 protein expressions (Supplementary Figure 7A). There were no significant differences in PD-L1 expression between PBRM1-negative and PBRM1-positive samples in the 90 ccRCC tissue array samples (Supplementary Figure 7B). PD-L1 expression was also not upregulated in the PBRM1MUT ccRCC patients from the TCGA dataset (Supplementary Figure 7C). Motzer et al. showed that PD-L1 was not a good biomarker for immunotherapy in ccRCC patients based on IHC analysis [9]. Chen et al. reported that IFN-γ upregulates PD-L1 on exosomal vesicles, which inhibits the function of CD8+T cells, thereby facilitating melanoma progression [44]. We also showed that treatment of ccRCC cells with 10 ng/μL IFN-γ increased the expression of exosomal PD-L1 (Supplementary Figure 7D, 7E). This suggests that elevated IFN-γ signaling in ccRCC cells upregulates exosomal PD-L1 expression and inhibits CD8+T cells in the TME.
Our study showed that infiltration of resting mast cells was significantly enriched in PBRM1MUTccRCC patients (Figures 1B, 2B, 2D). This was further confirmed by in vitro Transwell migration experiments that showed significant increase in HMC-1 cell migration when co-cultured with CM from PBRM1-silenced ccRCC cells (Figure 5C, 5D). Moreover, PBRM1 down expression correlated with increased CCL5 expression (Figure 7A, 7B). But, there was no change in SCF levels in PBRM1-silenced ccRCC cells and in PBRM1MUTccRCC patients from the TCGA dataset. CCL5 is a chemoattractant for mast cells, which function as immunosuppressive cells that inhibit natural killer (NK) cells and other immune cells [31, 32]. We demonstrate that NK cells are inhibited in PBRM1MUTccRCC patients (Figure 2B). Mast cells secrete TNF-α, an inducer for tumor angiogenesis [31]. Our study demonstrates that TNF-α signaling pathway is activated in PBRM1MUT ccRCC patients (Figure 8C), and also consisted with our tube formation results (Figure 6C). Mast cells also suppress T cells, which are a critical subset of cells that suppress tumor growth and progression [31]. Our results demonstrate reduced numbers of CD8+T cells and increased numbers of mast cells in PBRM1MUTccRCC patients (Figure 2B). Our results are consistent with the study by Xiong et al., which reports that mast cells reduce CD8+T cell infiltration, and aberrant production of immunosuppressive cytokines, IL-10 and TGF-β in the ccRCC TCGA KIRC and SATO cohorts [36]. Mast cells promote tumor microvessel density by activating the PI3K-AKT-GSK3-AM signaling pathway [37]. They also promote metastatic escape of tumor cells by upregulating matrix metalloproteases like MMP9 [31, 45]. They are also involved in the regulation of extracellular matrix remodeling, which is necessary for tumor metastasis [36]. However, the interaction of mast cells with other cell types in the tumor microenvironment remains unclear, and is an active area of research because its understanding may benefit cancer prognosis and therapy.
In conclusion, as shown in Figure 9, we demonstrate that PBRM1MUT ccRCC patients produce and secrete excessive CCL5, which recruits higher number of mast cells into the tumor microenvironment. The mast cells secrete excessive immunosuppressive cytokines like IL-10 and TGF-β, which inhibits CD8+ T cell infiltration and function. This contributes to increased growth and progression of PBRM1MUT ccRCC.
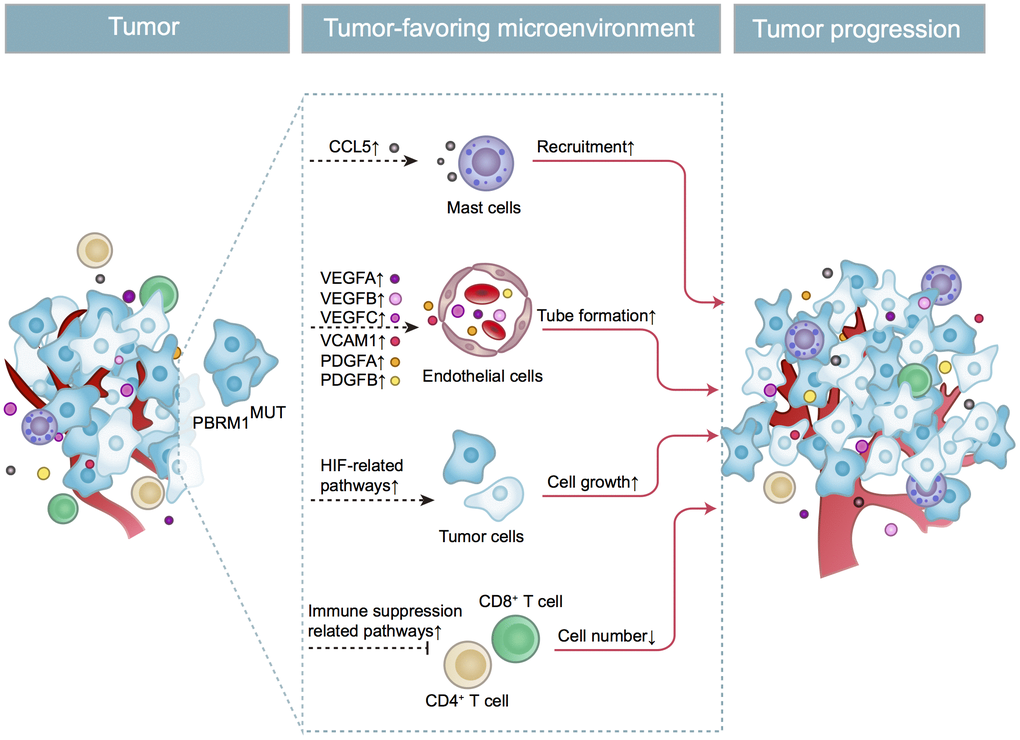
Figure 9. Schematic representation shows the mechanism through which PBRM1MUT ccRCC cells modulate tumor microenvironment and promote ccRCC progression. The PBRM1 mutant ccRCC cells secrete CCL5 cytokines that promote mast cell recruitment into the TME. The mast cells secrete several factors such as VEGFA, VCAM1, and PDGFA that stimulate angiogenesis. The mast cells also reduce the infiltration of CD8+ T cells and CD4+ T cells. Simultaneously, PBRM1 mutations facilitate tumor cell growth by activating intrinsic HIF signaling pathways. The complex interactions between the mast cells, epithelial cells, T cells, and ccRCC tumor cells in the TME are aided by several cytokines and chemokines that are secreted by these cells regulates tumor progression.
Materials and Methods
Patient datasets and preliminary
We downloaded the transcriptome (count and FPKM value), clinical, and mutational data for 539 ccRCC patients from The Cancer Genome Atlas (TCGA, https://www.cancer.gov/tcga) database and for the GSE76199 and GSE36895 datasets from the gene expression omnibus (GEO: https://www.ncbi.nlm.nih.gov/geo/) database [46, 47]. The wild-type PBRM1 (PBRM1WT) and mutant PBRM1 (PBRM1MUT) patient groups were determined by first removing the low-value genes using heterogeneity analysis followed by normalizing the data sets using the variance stabilizing transformation (VST) method in the DESeq2 package as previously described [48]. Finally, the two groups of data were hierarchically clustered, and the heterogeneous samples in the two groups were excluded. The wild-type VHL (VHLWT) and mutant VHL (VHLMUT) patient groups were established as described above for PBRM1. The GSE76199 dataset also contained transcriptome data for PBRM1-overexpressing Caki-2 cell lines.
Identifying top 20 gene mutations in the TCGA ccRCC dataset
Maftools was used to identify the top 20 gene mutations in the ccRCC dataset of the TCGA KIRC (kidney renal clear cell carcinoma) database [49].
Analysis of tumor infiltration of immune cells
To determine infiltration of twenty-two types of immune cells in ccRCC, we converted the count values in the TCGA KIRC transcript data into TPM (transcripts per kilobase of exon model per million mapped reads) values. Then, we removed outlier samples and calculated the infiltration of the 22 immune cells in 178 samples including those with wild-type and mutant PBRM1 with the CIBERSORT algorithm (https://cibersort.stanford.edu/) using 1000 permutations and the LM22 expression matrix [50]. The immune cell fractions were considered accurate when the CIBERSORT output reached p < 0.05.
Immune and stromal purity score analysis using ESTIMATE algorithm
The transcriptome data was analyzed using ESTIMATE algorithm to determine stromal and immune purity scores for the ccRCC samples from the TCGA KIRC database [39]. The stromal and immune purity scores for the PBRM1WT and PBRM1MUT groups were expressed as mean ± standard error (S.E).
Gene clusters and coexpression network analysis
We analyzed gene expression data of 178 ccRCC samples with the Weighted Correlation Network Analysis (WGCNA) package and identified 28 gene cluster modules using softpower = 6 [51]. Then we established co-expression networks within these 28 gene cluster modules to determine the correlation between immune cell infiltration and gene mutations (VHL, PBRM1, SETD2, and BAP1).
Identification of differentially expressed genes
The Robust Multiarray Average (RMA) was used to normalize the GSE36895 chip data, and KNN (k-NearestNeighbor) method was performed to calculate and complement the values. Then, differentially expressed genes (DEGs) in the PBRM1WT and PBRM1MUT groups from the GSE36895 dataset were identified using the limma package with P<0.05, adjusted P<0.05, and |fold change|>2 as threshold parameters [52]. For the TCGA transcriptome dataset, edgeR package was used to identify the DEGs between the PBRM1WT and PBRM1MUT groups with P<0.05, FDR<0.05, and |fold change|>2 as threshold parameters [53].
Functional enrichment analysis
Metascape was used for data visualization of functional enrichment analysis [54]. Kyoto Encyclopedia of Genes and Genomes (KEGG) analysis was used to analyze the DEGs and determine the reactome, hallmark, and canonical gene sets based on threshold parameters, including P<0.01, minimum overlap>3, and minimum enrichment>1.5. Furthermore, gene set enrichment analysis (GSEA) was performed using edgeR and clusterProfiler packages to determine significantly altered pathways between the PBRM1WT and PBRM1MUT groups and the CCL5High and CCL5Low groups in the ccRCC samples of the TCGA dataset [55, 56].
Survival analysis
The survival and survminer packages were used to perform 2-gene survival analysis and determine the effects of CCL5, PBRM1, and IFN-γ (interferon-gamma) on the overall survival of ccRCC patients from the the TCGA dataset. The survival curves were analyzed using the log-rank test. COX regression analysis was used to calculate the corresponding HR value in the PBRM1/CCL5 and CCL5/IFN-γ 2-gene survival analysis. The HR value of the control group (PBRM1High/CCL5Low, CCL5High/ IFN-γLow, PBRM1High/IFN-γLow, respectively) was 1.
Cell lines and cell culture
We purchased the human renal cancer cell lines, Caki-1 and 786-O, human mast cell line, HMC-1, and human umbilical vein endothelial cell (HUVEC) from the American Type Culture Collection (ATCC, Manassas, VA, USA). The cell lines were grown in RPMI 1640 or IMDM medium (Gibco-Thermo Fisher Scientific, Inc., Waltham, MA, USA), supplemented with 10% (v/v) fetal bovine serum (FBS; Gibco-Thermo Fisher Scientific, Inc., Waltham, MA, USA) at 37°C and 5% CO2 in a humidified incubator.
Transfections
The ccRCC cells were cultured in 6-well culture dishes for 24 h and transfected with the siRNA against PBRM1, or siCCL5 (si-PBRM1 and siCCL5; Ribobio, Guangzhou, China) using X-tremeGENE siRNA transfection reagent kit (Roche Co. Ltd., Shanghai, China) according to the manufacturer’s protocol. The transfection efficiency was verified using quantitative real-time PCR (qRT-PCR) and western blotting analyses.
Real-time quantitative PCR
Total cellular RNA was isolated using the RNA Fast 200 kit (Feijie Biotech, Shanghai, China) according to manufacturer’s protocol. The cDNA synthesis was performed using Prime Script™ RT reagent kit (Takara Biotechnology Co. Ltd., Dalian, China) and subsequently, qPCR was performed using the SYBR Green PCR Master Mix (Takara Biotechnology Co. Ltd., Dalian, China). The relative expression of PBRM1 and CCL5 was calculated by the 2–ΔΔCt method [57]. GAPDH was used as the internal control. The primers used for qPCR are as follows: GAPDH forward: 5’-AT GGGGAAGGTGAAGGTCGG-3’; GAPDH reverse: 5’-GACGGTGCCATGGAAT TTGC-3’; PBRM1 forward: 5’-AGGAGGAGACTTTCCAATCTTCC-3’; PBRM1 reverse: 5’-CTTCGCTTTGGTGCCCTAATG-3’; CCL5 forward: 5’-CCAGCAGTCGTCTTTGTCAC-3’; CCL5 reverse: 5’-CTCTGGGTTGGCACACACTT-3’.
MTT assay
We performed 3-(4,5-dimethyl-2-thiazolyl)-2,5-diphenyl-2-H-tetrazolium bromide (MTT) cell viability assay as previously described [58]. Briefly, we seeded 4×10³ si-PBRM1 and si-NC-transfected cells in a 96-well plate for 48 h. Then, we added 10 μl of MTT to each well and incubated for 4 h. The OD was measured at 450 nm in a plate reader. The cell viability rate was calculated as the average OD value of the siPBRM1 group/average OD value of the siNC group × 100%.
Western blotting analysis
Western blotting was performed as described previously [59]. Briefly, total protein lysates were prepared using RIPA buffer and quantified using BCA protein assay (#23225, Thermo Scientific Inc., IL, USA). Then, equal amounts of proteins were separated on 12% SDS-PAGE followed by transfer onto nitrocellulose membranes. Then, the membranes were blocked with 5% skimmed milk for 1 h at room temperature. Then, the membranes were incubated overnight with primary rabbit anti-human PBRM1 antibody (#A10009; 1:1000; ABclonal, Wuhan, China) and anti-β-actin antibody (#JB09, 1:1000, Absin, Shanghai, China) as an internal control. Later, the membranes were incubated with horseradish peroxidase (HRP)-conjugated goat anti-rabbit IgG (#ZB-2301, 1:2,000, Beijing Zhongshan Golden Bridge Biotechnology, Co. Ltd., Beijing, China) or HRP-conjugated goat anti-mouse IgG (#ZB-2305, 1:2000, Beijing Zhong-shan Golden Bridge Biotechnology, Co. Ltd., Beijing, China) for 1 h at room temperature. The blots were developed using the Supersignal TM West Pico Plus Chemiluminescent Substrate kit (#34580, Thermo Scientific Inc., IL, USA) according to manufacturer’s instructions and the protein bands were visualized using the Molecular Imager ChemiDoc XRS system (Bio-Rad Laboratories, Inc., Hercules, CA, USA). The PBRM1 protein levels were quantified relative to β-actin levels in each sample using the Image J software.
Conditioned media
We seeded 40×104 control and PBRM1 knockdown cells in 6-cm culture dishes for 24 h. Then, the cells were washed twice with serum-free medium (SFM) and further incubated for 24 h with 3 mL SFM. Then, we centrifuged the conditioned media to remove all cell debris and stored the CMs at −80°C for further experiments.
Colony formation assay
We cultured 1× 10³ control and PBRM1 knockdown cells in 6-well plates for 7 days at 37oC and 5% CO2. Then, the colonies were stained with 0.5% w/v crystal violet and under a light microscope (Nikon ECLIPSE Ts2R, Japan).
Cell cycle analysis
The si-NC- and si-PBRM1-transfected ccRCC cells were washed with phosphate-buffered saline (PBS) and permeabilized with pre-chilled 70% ethanol at -20°C overnight. The cells were then washed twice with PBS and incubated with propidium iodide (PI) in the dark for 30 min as previously described [59]. Then, the cell cycle distribution of samples was analyzed using a FACSCalibur flow cytometer (BD Biosciences, San Jose, CA) and the CELLFIT software was used to examine the cell cycle distribution.
Mast cell recruitment assay
We used a 24-well transwell co-culture assay to estimate in vitro mast cell recruitment. Briefly, 10× 104 cells PBRM1-knockdown ccRCC cells (786-O and Caki-1) were seeded into the lower chamber, after 24 h, the bottom of a 8 μm polycarbonate filter was coated with 10 μg/ml fibronectin (sc-29011 Santa Cruz Biotechnology) at 37°C and 5% CO2 in a humidified incubator for 4 h, 5×10⁴ HMC-1 cells were seeded in the upper chambers. For conditioned media recruitment, the lower chamber was added 900 μL of pre-warmed conditioned media from PBRM1-knockdown or control ccRCC, and incubated at 37°C and 5% CO2 in a humidified incubator for 24 h. Then, the migrating HMC-1 cells at the bottom side of the filters were fixed with 4% paraformaldehyde for 10 mins, washed thrice with PBS, and stained with 0.5% w/v crystal violet for 15 mins. Then the total numbers of migrating HMC-1 cells were measured in 3 random fields to estimate mast cell recruitment efficiency.
ELISA assay
We used the Proteintech human CCL5 ELISA Kit (#KE00093, Proteintech Inc., IL, USA) to measure human CCL5 levels in the conditioned media from control and PBRM1 knockdown ccRCC cells according the manufacturer’s instructions.
Tube formation assay
A 24-well plant was coated with matrigel (BD Biosciences, Franklin Lakes, NJ, USA) for 4 h at 37 °C, then HUVECs (1×10⁵/well) were suspended in CMs and seeded into 24 well plate. After 3 h, photographs were taken under a light microscope (Nikon ECLIPSE Ts2R, Japan).
Immunohistochemistry
We purchased tissue microarrays (#HKidE180Su03, including 90 adjacent kidney tissues and 90 ccRCC patients) from Shanghai Outdo BioTeck Co. Ltd (Shanghai, China) and performed immunohistochemical staining of PBRM1 (Abcam, dilution 1:200, #ab196022) and Tryptase (Abcam, dilution 1:500, #ab134932) using a DAKO Autostainer Plus system (#GK600505, Gene Tech Company, Shanghai, China). Immunohistochemical staining scores and mast cell density were determined as previously described [37]. Briefly, the staining percentage of the relative number of cells stained was graded as follows: 0 for 0%, 1 for ≤ 25%, 2 for 25–50%, 3 for 50–75% and 4 for ≥ 75%. IHC intensity was scored as follows: 0 for no staining, 1 for weakly positive staining, 2 for moderately positive staining and 3 for strongly positive staining. The total score of each section was calculated by multiplying the intensity and percentage scores. For mast cell density (MCD), the number of mast cells in 5 random field (1 mM × 1 mM) was counted, and the average was MCD.
Statistical analysis
Bioinformatics analyses were performed using the R software version 3.6.1. The Graph Pad Prism version 6.0 software (GraphPad, USA) was used to perform Pearson’s correlation analysis, linear regression analyses, and analyze differences between groups using Student’s t-test. A p value less than 0.05 was considered statistically significant.
Supplementary Materials
Author Contributions
Funding acquisition: Shan Xu, Qing Xia; Resources: Haibao Zhang, Tao Hou, Yule Chen, Guodong Zhu, Dalin He, Lei Li; Conceptualization: Lei Li, Shan Xu; Project administration: Lei Li, Shan Xu, Tianjie Liu; Investigation: Haibao Zhang, Wenjie Yang, Tao Hou, Guodong Zhu; Data curation: Dalin He; Formal analysis: Peixin Qi, Lv Wei; Methodology: Shan Xu, Qing Xia, Tianjie Liu; Software: Shan Xu, Tianjie Liu, Xiaoyun Gu, Zixi Wang; Supervision: Dalin He; Validation: Zixi Wang; Visualization: Zixi Wang, Shan Xu, Tianjie Liu, Xiaoyun Gu, Guodong Zhu; Writing – original draft: Shan Xu, Tianjie Liu, Qing Xia, Writing – review and editing: Lei Li, Shan Xu.
Acknowledgments
Professor Huilian Hou, she is a pathologist in the department of pathology in the First Affiliated Hospital of Xi’an Jiaotong University. We thank for her contribution to double check the histology of all ccRCC used in Figure 4C.
Conflicts of Interest
The authors declare that there are no conflicts of interest.
Funding
This study was supported by the National Natural Science Foundation of China (NSFC No. 81602244 to Shan Xu), Natural Science Basic Research Plan in Shaanxi Province of China (Program No. 2017JM8018 to Shan Xu), and Young Scientist Project of the National Natural Science Foundation of China (NSFC No. 81702843 to Qing Xia).
References
- 1. Siegel RL, Miller KD, Jemal A. Cancer statistics, 2020. CA Cancer J Clin. 2020; 70:7–30. https://doi.org/10.3322/caac.21590 [PubMed]
- 2. Ricketts CJ, De Cubas AA, Fan H, Smith CC, Lang M, Reznik E, Bowlby R, Gibb EA, Akbani R, Beroukhim R, Bottaro DP, Choueiri TK, Gibbs RA, et al, and Cancer Genome Atlas Research Network. The cancer genome atlas comprehensive molecular characterization of renal cell carcinoma. Cell Rep. 2018; 23:313–26.e5. https://doi.org/10.1016/j.celrep.2018.03.075 [PubMed]
- 3. Turajlic S, Swanton C, Boshoff C. Kidney cancer: the next decade. J Exp Med. 2018; 215:2477–79. https://doi.org/10.1084/jem.20181617 [PubMed]
- 4. Liao L, Testa JR, Yang H. The roles of chromatin-remodelers and epigenetic modifiers in kidney cancer. Cancer Genet. 2015; 208:206–14. https://doi.org/10.1016/j.cancergen.2015.02.008 [PubMed]
- 5. McDermott DF, Drake CG, Sznol M, Choueiri TK, Powderly JD, Smith DC, Brahmer JR, Carvajal RD, Hammers HJ, Puzanov I, Hodi FS, Kluger HM, Topalian SL, et al. Survival, durable response, and long-term safety in patients with previously treated advanced renal cell carcinoma receiving nivolumab. J Clin Oncol. 2015; 33:2013–20. https://doi.org/10.1200/JCO.2014.58.1041 [PubMed]
- 6. Roskoski R
Jr . Vascular endothelial growth factor (VEGF) and VEGF receptor inhibitors in the treatment of renal cell carcinomas. Pharmacol Res. 2017; 120:116–32. https://doi.org/10.1016/j.phrs.2017.03.010 [PubMed] - 7. Cella D, Grünwald V, Escudier B, Hammers HJ, George S, Nathan P, Grimm MO, Rini BI, Doan J, Ivanescu C, Paty J, Mekan S, Motzer RJ. Patient-reported outcomes of patients with advanced renal cell carcinoma treated with nivolumab plus ipilimumab versus sunitinib (CheckMate 214): a randomised, phase 3 trial. Lancet Oncol. 2019; 20:297–310. https://doi.org/10.1016/S1470-2045(18)30778-2 [PubMed]
- 8. Mok TS, Wu YL, Kudaba I, Kowalski DM, Cho BC, Turna HZ, Castro G
Jr , Srimuninnimit V, Laktionov KK, Bondarenko I, Kubota K, Lubiniecki GM, Zhang J, et al, and KEYNOTE-042 Investigators. Pembrolizumab versus chemotherapy for previously untreated, PD-L1-expressing, locally advanced or metastatic non-small-cell lung cancer (KEYNOTE-042): a randomised, open-label, controlled, phase 3 trial. Lancet. 2019; 393:1819–30. https://doi.org/10.1016/S0140-6736(18)32409-7 [PubMed] - 9. Motzer RJ, Penkov K, Haanen J, Rini B, Albiges L, Campbell MT, Venugopal B, Kollmannsberger C, Negrier S, Uemura M, Lee JL, Vasiliev A, Miller WH
Jr , et al. Avelumab plus axitinib versus sunitinib for advanced renal-cell carcinoma. N Engl J Med. 2019; 380:1103–15. https://doi.org/10.1056/NEJMoa1816047 [PubMed] - 10. Rini BI, Powles T, Atkins MB, Escudier B, McDermott DF, Suarez C, Bracarda S, Stadler WM, Donskov F, Lee JL, Hawkins R, Ravaud A, Alekseev B, et al. Atezolizumab plus bevacizumab versus sunitinib in patients with previously untreated metastatic renal cell carcinoma (IMmotion151): a multicentre, open-label, phase 3, randomised controlled trial. Lancet. 2019; 393:2404–2415. https://doi.org/10.1016/S0140-6736(19)30723-8 [PubMed]
- 11. Bihr S, Ohashi R, Moore AL, Rüschoff JH, Beisel C, Hermanns T, Mischo A, Corrò C, Beyer J, Beerenwinkel N, Moch H, Schraml P. Expression and mutation patterns of PBRM1, BAP1 and SETD2 mirror specific evolutionary subtypes in clear cell renal cell carcinoma. Neoplasia. 2019; 21:247–56. https://doi.org/10.1016/j.neo.2018.12.006 [PubMed]
- 12. Porter EG, Dhiman A, Chowdhury B, Carter BC, Lin H, Stewart JC, Kazemian M, Wendt MK, Dykhuizen EC. PBRM1 regulates stress response in epithelial cells. iScience. 2019; 15:196–210. https://doi.org/10.1016/j.isci.2019.04.027 [PubMed]
- 13. Varela I, Tarpey P, Raine K, Huang D, Ong CK, Stephens P, Davies H, Jones D, Lin ML, Teague J, Bignell G, Butler A, Cho J, et al. Exome sequencing identifies frequent mutation of the SWI/SNF complex gene PBRM1 in renal carcinoma. Nature. 2011; 469:539–42. https://doi.org/10.1038/nature09639 [PubMed]
- 14. Kadoch C, Crabtree GR. Mammalian SWI/SNF chromatin remodeling complexes and cancer: mechanistic insights gained from human genomics. Sci Adv. 2015; 1:e1500447. https://doi.org/10.1126/sciadv.1500447 [PubMed]
- 15. Zhou H, Liu J, Zhang Y, Huang Y, Shen J, Yang Y, Fang W, Zhang L. PBRM1 mutation and preliminary response to immune checkpoint blockade treatment in non-small cell lung cancer. NPJ Precis Oncol. 2020; 4:6. https://doi.org/10.1038/s41698-020-0112-3 [PubMed]
- 16. Mota ST, Vecchi L, Zóia MA, Oliveira FM, Alves DA, Dornelas BC, Bezerra SM, Andrade VP, Maia YC, Neves AF, Goulart LR, Araújo TG. New insights into the role of polybromo-1 in prostate cancer. Int J Mol Sci. 2019; 20:2852. https://doi.org/10.3390/ijms20122852 [PubMed]
- 17. Kapur P, Peña-Llopis S, Christie A, Zhrebker L, Pavía-Jiménez A, Rathmell WK, Xie XJ, Brugarolas J. Effects on survival of BAP1 and PBRM1 mutations in sporadic clear-cell renal-cell carcinoma: a retrospective analysis with independent validation. Lancet Oncol. 2013; 14:159–167. https://doi.org/10.1016/S1470-2045(12)70584-3 [PubMed]
- 18. Hakimi AA, Ostrovnaya I, Reva B, Schultz N, Chen YB, Gonen M, Liu H, Takeda S, Voss MH, Tickoo SK, Reuter VE, Russo P, Cheng EH, et al, and ccRCC Cancer Genome Atlas (KIRC TCGA) Research Network investigators. Adverse outcomes in clear cell renal cell carcinoma with mutations of 3p21 epigenetic regulators BAP1 and SETD2: a report by MSKCC and the KIRC TCGA research network. Clin Cancer Res. 2013; 19:3259–67. https://doi.org/10.1158/1078-0432.CCR-12-3886 [PubMed]
- 19. da Costa WH, da Cunha IW, Fares AF, Bezerra SM, Shultz L, Clavijo DA, da Silva DV, Netto GJ, Guimaraes GC, Cassio Zequi S. Prognostic impact of concomitant loss of PBRM1 and BAP1 protein expression in early stages of clear cell renal cell carcinoma. Urol Oncol. 2018; 36:243.e1–8. https://doi.org/10.1016/j.urolonc.2018.01.002 [PubMed]
- 20. Gossage L, Murtaza M, Slatter AF, Lichtenstein CP, Warren A, Haynes B, Marass F, Roberts I, Shanahan SJ, Claas A, Dunham A, May AP, Rosenfeld N, et al. Clinical and pathological impact of VHL, PBRM1, BAP1, SETD2, KDM6A, and JARID1c in clear cell renal cell carcinoma. Genes Chromosomes Cancer. 2014; 53:38–51. https://doi.org/10.1002/gcc.22116 [PubMed]
- 21. Högner A, Krause H, Jandrig B, Kasim M, Fuller TF, Schostak M, Erbersdobler A, Patzak A, Kilic E. PBRM1 and VHL expression correlate in human clear cell renal cell carcinoma with differential association with patient’s overall survival. Urol Oncol. 2018; 36:94.e1–14. https://doi.org/10.1016/j.urolonc.2017.10.027 [PubMed]
- 22. Wang Z, Peng S, Guo L, Xie H, Wang A, Shang Z, Niu Y. Prognostic and clinicopathological value of PBRM1 expression in renal cell carcinoma. Clin Chim Acta. 2018; 486:9–17. https://doi.org/10.1016/j.cca.2018.07.014 [PubMed]
- 23. Hakimi AA, Voss MH, Kuo F, Sanchez A, Liu M, Nixon BG, Vuong L, Ostrovnaya I, Chen YB, Reuter V, Riaz N, Cheng Y, Patel P, et al. Transcriptomic profiling of the tumor microenvironment reveals distinct subgroups of clear cell renal cell cancer: data from a randomized phase III trial. Cancer Discov. 2019; 9:510–25. https://doi.org/10.1158/2159-8290.CD-18-0957 [PubMed]
- 24. Pan D, Kobayashi A, Jiang P, Ferrari de Andrade L, Tay RE, Luoma AM, Tsoucas D, Qiu X, Lim K, Rao P, Long HW, Yuan GC, Doench J, et al. A major chromatin regulator determines resistance of tumor cells to T cell-mediated killing. Science. 2018; 359:770–75. https://doi.org/10.1126/science.aao1710 [PubMed]
- 25. Miao D, Margolis CA, Gao W, Voss MH, Li W, Martini DJ, Norton C, Bossé D, Wankowicz SM, Cullen D, Horak C, Wind-Rotolo M, Tracy A, et al. Genomic correlates of response to immune checkpoint therapies in clear cell renal cell carcinoma. Science. 2018; 359:801–06. https://doi.org/10.1126/science.aan5951 [PubMed]
- 26. Liu XD, Kong W, Peterson CB, McGrail DJ, Hoang A, Zhang X, Lam T, Pilie PG, Zhu H, Beckermann KE, Haake SM, Isgandrova S, Martinez-Moczygemba M, et al. PBRM1 loss defines a nonimmunogenic tumor phenotype associated with checkpoint inhibitor resistance in renal carcinoma. Nat Commun. 2020; 11:2135. https://doi.org/10.1038/s41467-020-15959-6 [PubMed]
- 27. Braun DA, Hou Y, Bakouny Z, Ficial M, Sant' Angelo M, Forman J, Ross-Macdonald P, Berger AC, Jegede OA, Elagina L, Steinharter J, Sun M, Wind-Rotolo M, et al. Interplay of somatic alterations and immune infiltration modulates response to PD-1 blockade in advanced clear cell renal cell carcinoma. Nat Med. 2020; 26:909–18. https://doi.org/10.1038/s41591-020-0839-y [PubMed]
- 28. Gandellini P, Andriani F, Merlino G, D’Aiuto F, Roz L, Callari M. Complexity in the tumour microenvironment: cancer associated fibroblast gene expression patterns identify both common and unique features of tumour-stroma crosstalk across cancer types. Semin Cancer Biol. 2015; 35:96–106. https://doi.org/10.1016/j.semcancer.2015.08.008 [PubMed]
- 29. Aran D, Sirota M, Butte AJ. Systematic pan-cancer analysis of tumour purity. Nat Commun. 2015; 6:8971. https://doi.org/10.1038/ncomms9971 [PubMed]
- 30. Fu H, Zhu Y, Wang Y, Liu Z, Zhang J, Wang Z, Xie H, Dai B, Xu J, Ye D. Tumor infiltrating mast cells (TIMs) confers a marked survival advantage in nonmetastatic clear-cell renal cell carcinoma. Ann Surg Oncol. 2017; 24:1435–42. https://doi.org/10.1245/s10434-016-5702-5 [PubMed]
- 31. Rigoni A, Colombo MP, Pucillo C. The role of mast cells in molding the tumor microenvironment. Cancer Microenviron. 2015; 8:167–76. https://doi.org/10.1007/s12307-014-0152-8 [PubMed]
- 32. Maltby S, Khazaie K, McNagny KM. Mast cells in tumor growth: angiogenesis, tissue remodelling and immune-modulation. Biochim Biophys Acta. 2009; 1796:19–26. https://doi.org/10.1016/j.bbcan.2009.02.001 [PubMed]
- 33. Ribatti D, Tamma R, Crivellato E. The dual role of mast cells in tumor fate. Cancer Lett. 2018; 433:252–58. https://doi.org/10.1016/j.canlet.2018.07.005 [PubMed]
- 34. Tamma R, Rutigliano M, Lucarelli G, Annese T, Ruggieri S, Cascardi E, Napoli A, Battaglia M, Ribatti D. Microvascular density, macrophages, and mast cells in human clear cell renal carcinoma with and without bevacizumab treatment. Urol Oncol. 2019; 37:355.e11–19. https://doi.org/10.1016/j.urolonc.2019.01.025 [PubMed]
- 35. Tuna B, Yorukoglu K, Unlu M, Mungan MU, Kirkali Z. Association of mast cells with microvessel density in renal cell carcinomas. Eur Urol. 2006; 50:530–34. https://doi.org/10.1016/j.eururo.2005.12.040 [PubMed]
- 36. Xiong Y, Liu L, Xia Y, Qi Y, Chen Y, Chen L, Zhang P, Kong Y, Qu Y, Wang Z, Lin Z, Chen X, Xiang Z, et al. Tumor infiltrating mast cells determine oncogenic HIF-2α-conferred immune evasion in clear cell renal cell carcinoma. Cancer Immunol Immunother. 2019; 68:731–41. https://doi.org/10.1007/s00262-019-02314-y [PubMed]
- 37. Chen Y, Li C, Xie H, Fan Y, Yang Z, Ma J, He D, Li L. Infiltrating mast cells promote renal cell carcinoma angiogenesis by modulating PI3K→AKT→GSK3β→AM signaling. Oncogene. 2017; 36:2879–88. https://doi.org/10.1038/onc.2016.442 [PubMed]
- 38. Marech I, Gadaleta CD, Ranieri G. Possible prognostic and therapeutic significance of c-kit expression, mast cell count and microvessel density in renal cell carcinoma. Int J Mol Sci. 2014; 15:13060–76. https://doi.org/10.3390/ijms150713060 [PubMed]
- 39. Yoshihara K, Shahmoradgoli M, Martínez E, Vegesna R, Kim H, Torres-Garcia W, Treviño V, Shen H, Laird PW, Levine DA, Carter SL, Getz G, Stemke-Hale K, et al. Inferring tumour purity and stromal and immune cell admixture from expression data. Nat Commun. 2013; 4:2612. https://doi.org/10.1038/ncomms3612 [PubMed]
- 40. Cho H, Du X, Rizzi JP, Liberzon E, Chakraborty AA, Gao W, Carvo I, Signoretti S, Bruick RK, Josey JA, Wallace EM, Kaelin WG. On-target efficacy of a HIF-2α antagonist in preclinical kidney cancer models. Nature. 2016; 539:107–11. https://doi.org/10.1038/nature19795 [PubMed]
- 41. Frew IJ, Moch H. A clearer view of the molecular complexity of clear cell renal cell carcinoma. Annu Rev Pathol. 2015; 10:263–89. https://doi.org/10.1146/annurev-pathol-012414-040306 [PubMed]
- 42. Ricketts CJ, Crooks DR, Sourbier C, Schmidt LS, Srinivasan R, Linehan WM. SnapShot: renal cell carcinoma. Cancer Cell. 2016; 29:610–10.e1. https://doi.org/10.1016/j.ccell.2016.03.021 [PubMed]
- 43. Gao W, Li W, Xiao T, Liu XS, Kaelin WG
Jr . Inactivation of the PBRM1 tumor suppressor gene amplifies the HIF-response in VHL-/- clear cell renal carcinoma. Proc Natl Acad Sci USA. 2017; 114:1027–32. https://doi.org/10.1073/pnas.1619726114 [PubMed] - 44. Chen G, Huang AC, Zhang W, Zhang G, Wu M, Xu W, Yu Z, Yang J, Wang B, Sun H, Xia H, Man Q, Zhong W, et al. Exosomal PD-L1 contributes to immunosuppression and is associated with anti-PD-1 response. Nature. 2018; 560:382–86. https://doi.org/10.1038/s41586-018-0392-8 [PubMed]
- 45. Krstic J, Santibanez JF. Transforming growth factor-beta and matrix metalloproteinases: functional interactions in tumor stroma-infiltrating myeloid cells. ScientificWorldJournal. 2014; 2014:521754. https://doi.org/10.1155/2014/521754 [PubMed]
- 46. Barrett T, Wilhite SE, Ledoux P, Evangelista C, Kim IF, Tomashevsky M, Marshall KA, Phillippy KH, Sherman PM, Holko M, Yefanov A, Lee H, Zhang N, et al. NCBI GEO: archive for functional genomics data sets—update. Nucleic Acids Res. 2013; 41:D991–95. https://doi.org/10.1093/nar/gks1193 [PubMed]
- 47. Chowdhury B, Porter EG, Stewart JC, Ferreira CR, Schipma MJ, Dykhuizen EC. PBRM1 regulates the expression of genes involved in metabolism and cell adhesion in renal clear cell carcinoma. PLoS One. 2016; 11:e0153718. https://doi.org/10.1371/journal.pone.0153718 [PubMed]
- 48. Love MI, Huber W, Anders S. Moderated estimation of fold change and dispersion for RNA-seq data with DESeq2. Genome Biol. 2014; 15:550. https://doi.org/10.1186/s13059-014-0550-8 [PubMed]
- 49. Mayakonda A, Lin DC, Assenov Y, Plass C, Koeffler HP. Maftools: efficient and comprehensive analysis of somatic variants in cancer. Genome Res. 2018; 28:1747–56. https://doi.org/10.1101/gr.239244.118 [PubMed]
- 50. Newman AM, Liu CL, Green MR, Gentles AJ, Feng W, Xu Y, Hoang CD, Diehn M, Alizadeh AA. Robust enumeration of cell subsets from tissue expression profiles. Nat Methods. 2015; 12:453–57. https://doi.org/10.1038/nmeth.3337 [PubMed]
- 51. Langfelder P, Horvath S. WGCNA: an R package for weighted correlation network analysis. BMC Bioinformatics. 2008; 9:559. https://doi.org/10.1186/1471-2105-9-559 [PubMed]
- 52. Ritchie ME, Phipson B, Wu D, Hu Y, Law CW, Shi W, Smyth GK. Limma powers differential expression analyses for RNA-sequencing and microarray studies. Nucleic Acids Res. 2015; 43:e47. https://doi.org/10.1093/nar/gkv007 [PubMed]
- 53. Robinson MD, McCarthy DJ, Smyth GK. edgeR: a bioconductor package for differential expression analysis of digital gene expression data. Bioinformatics. 2010; 26:139–40. https://doi.org/10.1093/bioinformatics/btp616 [PubMed]
- 54. Zhou Y, Zhou B, Pache L, Chang M, Khodabakhshi AH, Tanaseichuk O, Benner C, Chanda SK. Metascape provides a biologist-oriented resource for the analysis of systems-level datasets. Nat Commun. 2019; 10:1523. https://doi.org/10.1038/s41467-019-09234-6 [PubMed]
- 55. Yu G, Wang LG, Han Y, He QY. clusterProfiler: an R package for comparing biological themes among gene clusters. OMICS. 2012; 16:284–87. https://doi.org/10.1089/omi.2011.0118 [PubMed]
- 56. Subramanian A, Tamayo P, Mootha VK, Mukherjee S, Ebert BL, Gillette MA, Paulovich A, Pomeroy SL, Golub TR, Lander ES, Mesirov JP. Gene set enrichment analysis: a knowledge-based approach for interpreting genome-wide expression profiles. Proc Natl Acad Sci USA. 2005; 102:15545–50. https://doi.org/10.1073/pnas.0506580102 [PubMed]
- 57. Livak KJ, Schmittgen TD. Analysis of relative gene expression data using real-time quantitative PCR and the 2(-delta delta C(T)) method. Methods. 2001; 25:402–08. https://doi.org/10.1006/meth.2001.1262 [PubMed]
- 58. Xu S, Zhang H, Liu T, Chen Y, He D, Li L. G protein γ subunit 7 loss contributes to progression of clear cell renal cell carcinoma. J Cell Physiol. 2019; 234:20002–12. https://doi.org/10.1002/jcp.28597 [PubMed]
- 59. Xu S, Guo P, Gao Y, Shi Q, He D, Gao Y, Zhang H. Acyldepsipeptides inhibit the growth of renal cancer cells through G1 phase cell cycle arrest. Biochem Biophys Res Commun. 2013; 438:468–72. https://doi.org/10.1016/j.bbrc.2013.07.119 [PubMed]