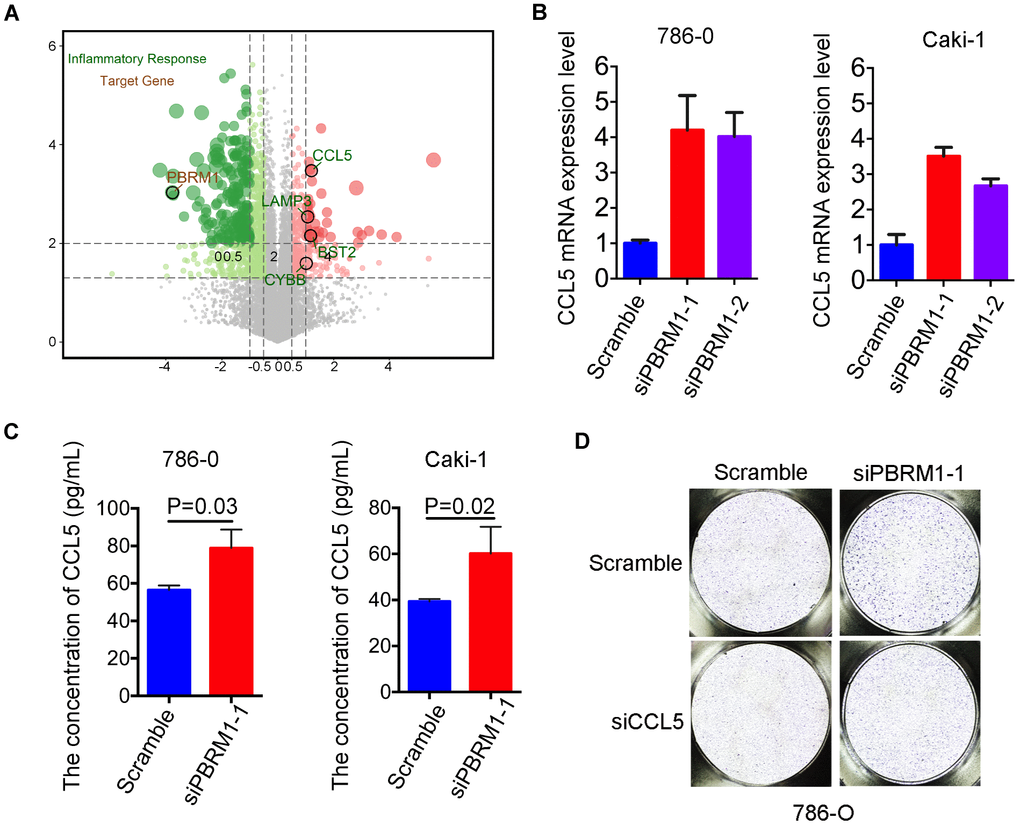
Figure 7.High CCL5 expression and secretion correlates with mast cell infiltration in PBRM1MUTccRCC cells and patients. (A) Volcano plot shows fold changes in gene expression in control and PBRM1-overexpressing Caki-2 cells. The association of immune response with mutations in PBRM1, VHL, SETD2 and BAP1 genes is shown in black circles. (B) qRT-PCR analysis shows CCL5 mRNA expression in 786-O- and Caki-1-silenced PBRM1 cells. (C) ELISA assay results show CCL5 levels in the conditioned media of control and PBRM1-silenced 786-O and Caki-1 cells using the human CCL5 ELISA kit. (D) Transwell migration assay results show total numbers of migrating HMC-1 cells when co-cultured with conditioned media derived from control, PBRM1-silenced and PBRM1-silenced plus CCL5-silenced 786-O cells. The migrating MHC-1 cells were stained with crystal violet and counted. Note: All experiments were performed in triplicate and are presented as means±SD; statistical analysis was performed using Student’s t-test.