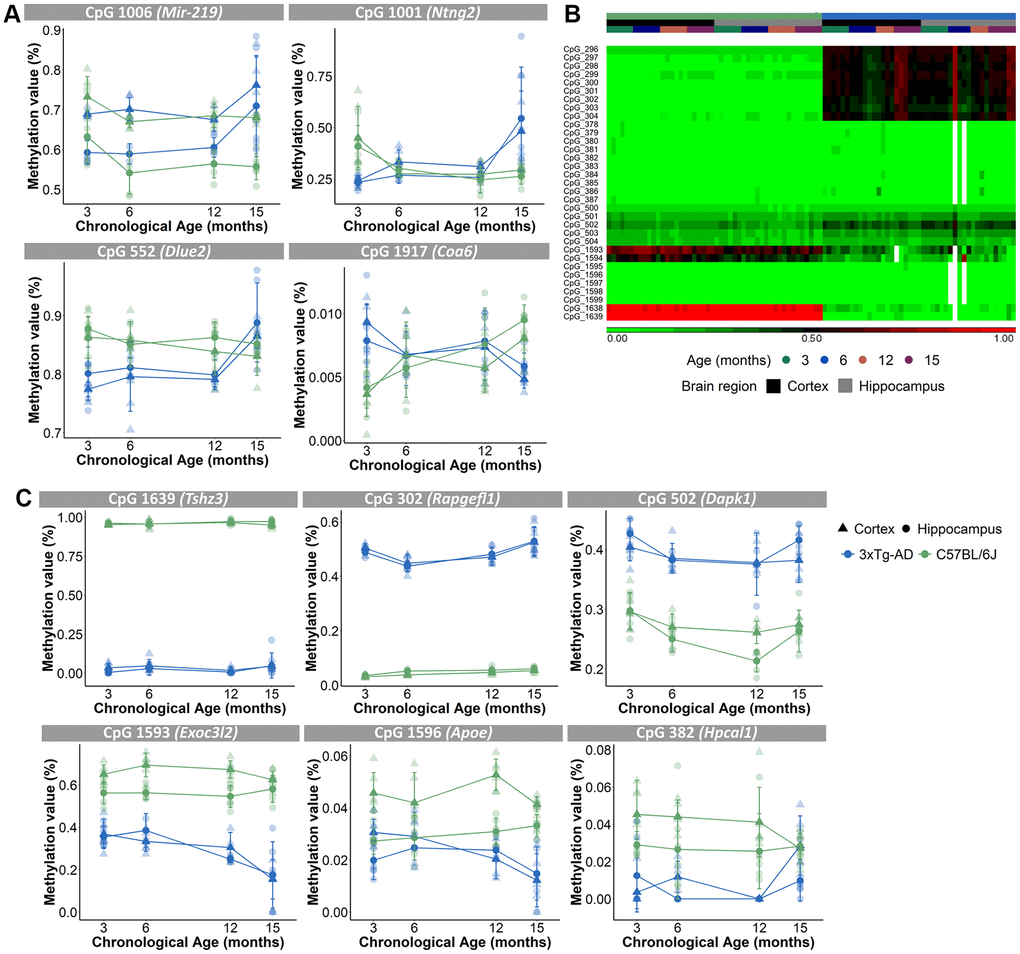
Figure 3.Different age-associated methylation profiles for AD mice compared to B6 mice. (A) Methylation profiles of CpGs in close proximity of Mir-219, Ntng2, Dlue2 and Coa6 genes for the cortex (triangles) and hippocampus (circles) were opposite for the AD (blue) and B6 (green) mice. N = 4. Mean ± SD. (B) Unsupervised hierarchical clustering using AD (blue) and B6 (green) mouse cortex (black) and hippocampus (grey) for 33 of the 157 CpG-sites that were differentially methylated for strain. (C) Methylation profiles for the cortex (triangles) and hippocampus (circles) of CpGs, associated with AD-related genes Tshz3, Rapgefl1, Dapk1, Exoc3l2, Apoe and Hpcal1 genes, show differing values between AD (blue) and B6 (green) mice.