


Introduction
The increase in life expectancy seen in developed countries is associated with an increased prevalence of chronic diseases such as cancer, neurodegeneration and cardiovascular disease [1]. This is due to the fact that aging is associated with a progressive decline in functional capacity of various cells and organs, eventually leading to disease and death [2]. Usually, the chronological age (i.e. the number of calendar years passed after birth) will deviate from biological age, which takes all health outcomes into account and is highly variable due to many interfering factors, e.g. genetics, environment and lifestyle [3]. Hence, in order to decipher how aging acts as a risk factor for chronic diseases, there is an urgent need for accurate measures of biological age [4]. A number of age predictors have been proposed to accurately measure biological age, e.g. telomere length and transcriptomic, proteomic, metabolomic and composite predictors. However, most of these biomarkers have drawbacks including a low predictive power for health span and insufficient validation [5].
Recently, the epigenetic changes associated with aging have gained much attention in the aging biomarker research field [6]. In addition to a general loss of histones and modifications of histone marks including H3K4me3, H4K16ac and H3K56ac [7], age-related changes of the epigenome include alterations in DNA methylation patterns which typically consist of 5-methylcytosine occurring at CpG dinucleotides [8]. Overall, aging induces a genome-wide loss of DNA methylation, although it can encompass hypermethylation at specific loci [9, 10]. Age-related DNA methylation changes that are highly reproducible have led to the development of so-called “epigenetic clocks”, by selecting specific CpG-sites that display age-dependent methylation states [11]. Horvath (2013) was the first to describe a human multi-tissue age-predictor based on the methylation states of 353 age-related CpGs [12]. A few years after the development of Horvath’s human epigenetic clock, a multi-tissue epigenetic age predictor in mice was published containing 329 age-associated CpG-sites [13] different from the ones selected by Horvath. These first epigenetic clocks were developed to accurately measure chronological age. Later, these and other epigenetic clocks were used to anticipate aging-related health outcomes both in humans [14–16] and in mice [17–19]. The difference between epigenetic age and chronological age, defined as the age acceleration, is already associated with mortality [20] and age-related diseases [14, 21]. Therefore, epigenetic clocks are currently considered the most promising predictor of biological age in comparison to other candidates [5, 22]. Furthermore, epigenetic clocks can be applied in developing longevity and rejuvenating interventions and in determining the impact of stress factors on biological age [23]. Although many research groups focused on multi-tissue epigenetic clocks, more accurate clocks could be established by using the methylation levels of tissue-specific CpG-sites [24], in part because differences in DNA methylation patterns are in general more pronounced between tissues than ages [25]. This may explain the sub-optimal performance of multi-tissue epigenetic clocks for biological estimation of specific tissues [26]. Therefore, tissue-specific clocks need to be developed which measure biological age in relation to age-related diseases, with the potential to serve as a prognostic and diagnostic marker of a certain age-associated disease, and to provide more insights in the underlying mechanisms involved [27–29]. Due to limited access of human tissue samples, mouse models will be of particular relevance to achieve this goal. Until now, tissue-specific clocks in mice have only been developed for blood [18, 30], liver [19] and muscle [31].
One of the most prevalent neurodegenerative diseases is Alzheimer’s disease (AD), accounting for 60-70% of the 50 million dementia patients worldwide [32]. An epigenetic clock was tested in AD patients in which an acceleration of the epigenetic age in the prefrontal cortex was suggested to be associated with the decline in cognitive function [33]. Besides the cortex, the hippocampus is also highly affected by AD contributing to the associated cognitive decline [34]. Furthermore, several AD risk factors, e.g. body mass index, cholesterol levels, blood pressure and smoking, were demonstrated to accelerate epigenetic age [35]. Further research is needed to increase our knowledge on how epigenetic age is associated with AD, and to potentially give further insights in the AD pathology. For this, animal experiments supplementing human research are very useful and enable to examine how soon during the disease process epigenetic age is modified, to determine risk factors for the accelerated aging linked to AD, and to test the efficacy of potential interventions delaying the increase in epigenetic age.
In this study, epigenetic clocks were developed and validated for mouse hippocampus and cortex. We measured the epigenetic age of cortex and hippocampus from young adult (3 months) to aged (15 months) female C57BL/6J and triple transgenic AD (3xTg-AD) mice (further referred to as B6 and AD mice, respectively), which are extensively used in AD research. The epigenetic age of AD cortex and hippocampus was found to be increased in comparison to that of B6 mice. The epigenetic age acceleration, which is thought to be associated with biological age, was elevated for the cortex in relation to the hippocampus in both mouse strains. Furthermore, the AD mice were epigenetically older when the first signs of AD pathology appeared, with slower rates of acceleration over time. Differences in DNA methylation of age-associated CpGs were more evident between brain regions than mouse strains and thirdly between various ages. Notably, several CpGs that showed opposite age-dependent DNA methylation profiles for both strains were related to neurodegenerative disease, such as AD. In addition, the most-significant age-associated CpG-sites clustered together in genomic regions encoding for developmental, aging-related and neuronal functions. Altogether, the developed brain region-specific epigenetic clocks can successfully be implemented in future research to measure brain epigenetic age to further unravel the role of epigenetics in neurodegenerative pathology.
Results
Epigenetic clocks specific for mouse hippocampal and cortical tissue
In a first instance, blood DNA samples were used for genome-wide reduced representation bisulfite sequencing using the Methyl-MidiSeq method from Zymo Research. This method covers ~30% of the entire methylome at single base resolution. From this, CpGs in differentially methylated regions (DMRs) were identified, and supplemented with age-dependent DNA methylation sites retrieved from the literature [13, 17, 19, 36, 37]. This generated a list of 2,031 individual CpGs in the mouse genome that were further analyzed using targeted bisulfite sequencing and used to train the proprietary DNAge® algorithm (see Materials and Methods). DNA methylation levels of cerebral cortex and hippocampus, dissected from B6 mice at 12, 24 and 64 weeks of age, served to train the algorithm. Separate algorithms were built specifically for cortex and hippocampus using respectively 1,144 and 732 CpGs out of the original 2,031 CpGs with 436 overlapping loci (see Supplementary Table 1). Both algorithms could very accurately predict epigenetic age as observed by almost perfect correlation to the chronological age of 0.9997 for cortex and of 0.9996 for hippocampus (Figure 1A and 1B). Both the cortex- and hippocampus-specific epigenetic clocks were subsequently validated on an independent sample set from 24-, 36-, 70-, 91- and 105-week old male B6 mice. Also in this validation phase, the cortical and hippocampal clocks performed very well, with coefficients of determination of 0.8614 and 0.8798, respectively (Figure 1C, 1D). The distribution of clock CpG-sites across genomic features was very comparable between the cortex and hippocampus, with a majority of them found in introns and CpG-islands (Figure 1E, 1F), of which the latter are inherently enriched in CpGs [38].
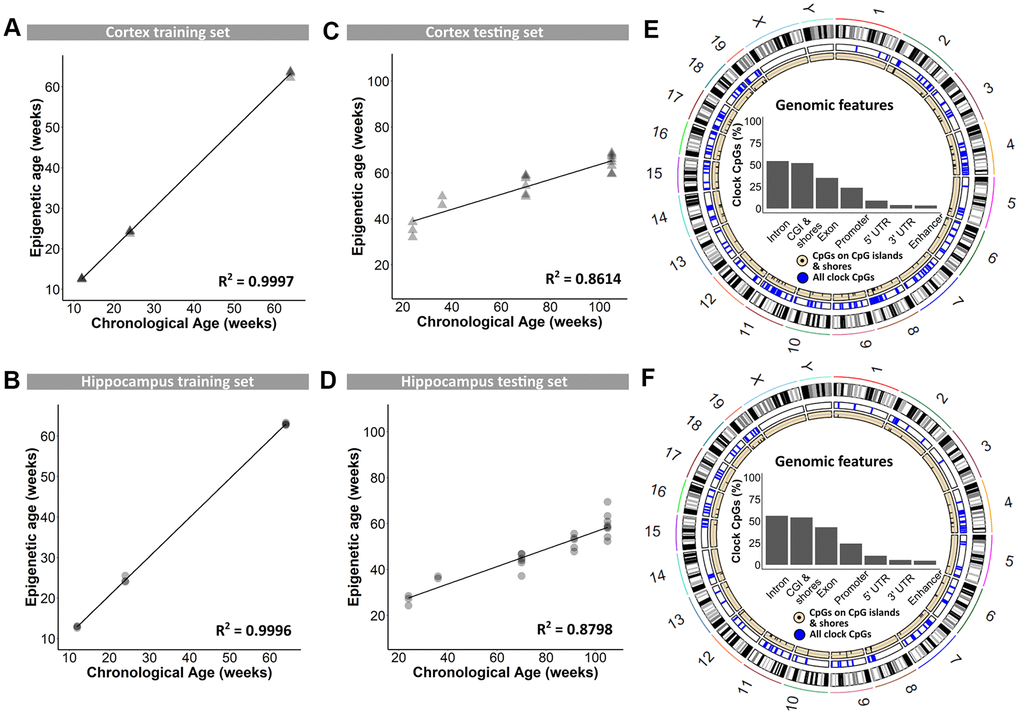
Figure 1. Training and testing of the DNAge® algorithm to predict chronological age in mouse cortical and hippocampal tissue. (A, B) A tissue-specific algorithm was designed for cortex (A) and hippocampus (B) to accurately predict chronological age. N = 3 – 4. (C, D) The DNAge® algorithm was tested on an independent sample set of male B6 mice for both cortex (C) and hippocampus (D). N = 2 – 8. (E, F) Circos plots indicate the genomic locations of clock CpG-sites in CpG-islands (black) and all clock CpG-sites (blue) in cortex (E) and hippocampus (F). Insets indicate relative distributions of clock CpG-sites across genomic features.
AD mice show an increased epigenetic age compared to B6 mice
The validated epigenetic clocks were then used to estimate the epigenetic ages of cortical and hippocampal tissues from 3-, 6-, 12- and 15-months old female B6 and AD mice (the DNA methylation values of the 2,031 CpG-sites can be found in Supplementary Table 2). Only female mice were used for this experiment as male AD mice show a more subtle AD pathology compared to female mice, which was obvious in our colony [39] and also reported by different research groups [40, 41]. Based on the DNAge® algorithms for cortex and hippocampus, the predicted epigenetic age of AD mice was significantly augmented in both cortex and hippocampus for all ages (Figure 2A, 2B). ΔAge which compared epigenetic age to chronological age was used to measure a potential acceleration or deceleration of aging. The ΔAge was higher in cortical tissue, compared to hippocampal tissue suggestive for a specific epigenetic aging speed for these distinct brain regions (Supplementary Figure 1A, 1B). We determined that the AD cortex was 6.7 months older (median difference) compared to their chronological age, while the hippocampus was 0.7 months younger (Figure 2C, 2D). As the mean lifespan of female AD mice is 17 months [42], we indicated for the cortex a 39.4% acceleration of their lifespan and for the hippocampus a 4.1% deceleration. Compared to their chronological age, the B6 cortex was 2.4 months older, while the hippocampus was 2.1 months younger (Figure 2C, 2D). Taking into account that the mean lifespan of female B6 mice is 25 months [43], the epigenetic clock revealed a 8.4% lifespan acceleration for the cortex and a 9.6% lifespan deceleration for the hippocampus. To reveal a potential increased age acceleration in the pathological mouse model, the ΔAge of B6 mice was compared to that of AD mice. This disclosed that, based on the DNAge® algorithm trained in B6 mice, the AD cortex had a positive age acceleration compared to the B6 cortex with a median difference of 4.3 months, while the median difference of the hippocampus was 1.4 months (Figure 2C, 2D). In line with previous studies [27], we observed non-linear epigenetic age trajectories, with slower rates of epigenetic aging over time. The epigenetic age of the B6 cortex accelerated (positive ΔAge) until 12 months of age, while for AD mice an acceleration was visible until 15 months of age (Figure 2E and Supplementary Figure 1C, 1D). For hippocampal tissue, the epigenetic age of B6 mice decelerated (negative ΔAge) at all time points. This is in contrast to the AD mice, in which epigenetic age was first accelerated at 3 and 6 months of age and then decelerated at 12 and 15 months of age (Figure 2F and Supplementary Figure 1C, 1D).
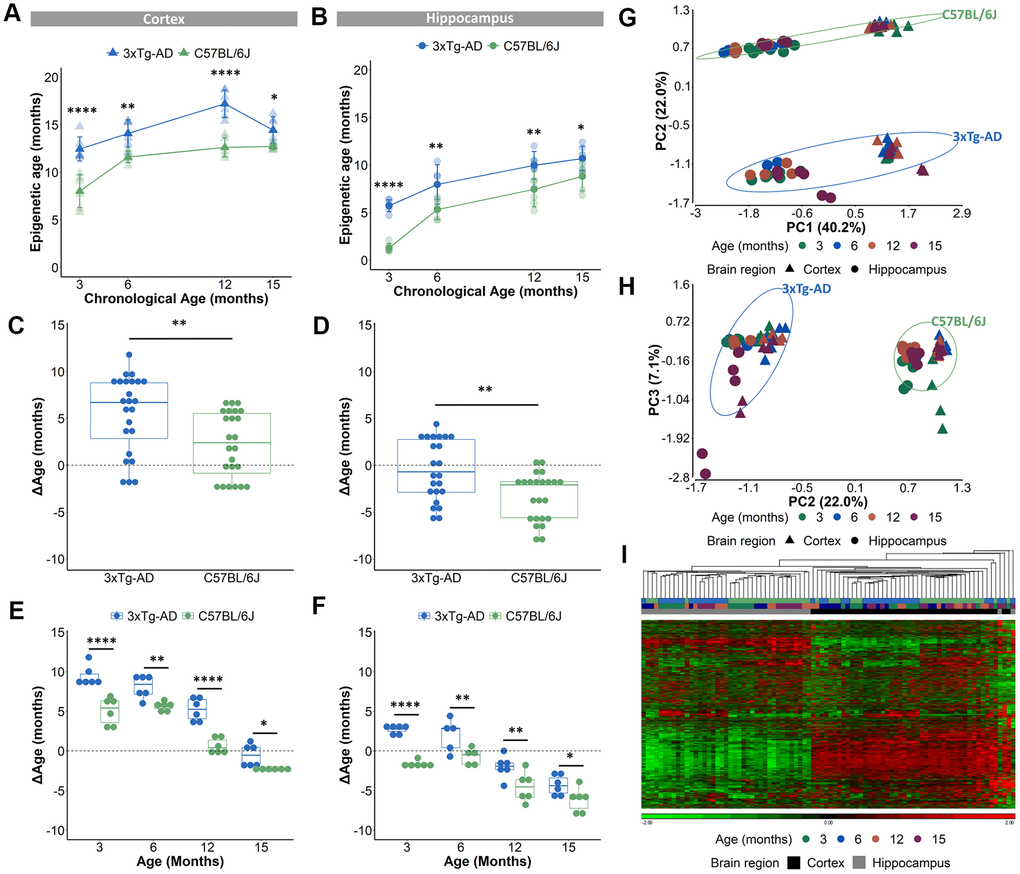
Figure 2. Acceleration of epigenetic age in AD mice compared to B6 mice in cortical and hippocampal tissue. (A, B) The predicted epigenetic age for cortex (A) and hippocampus (B) of AD (blue) and B6 (green) mice. Mean ± SD. (C, D) The mean ΔAge and (E, F) the ΔAge per chronological time point for cortex and hippocampus of AD (blue) and B6 (green) mice. N = 6. * p < 0.05, ** p < 0.01, **** p < 0.0001. (G, H) A principal component analysis (PCA) with PC1 and PC2 (G) and PC2 and PC3 (H) based on the DNA methylation value of 1696 CpGs in AD (blue) and B6 (green) mouse cortex (triangles) and hippocampus (circles). Age is colored by month. (I) Based on the same 1696 CpGs, unsupervised hierarchical clustering was performed using the AD (blue) and B6 (green) mouse cortex (black) and hippocampus (grey).
Because a substantial number of the 2,031 CpG loci had missing DNA methylation values, we decided to exclude those CpGs for further analyses, which resulted in 1,696 CpGs (see Materials and Methods). A principal component analysis (PCA), executed to analyze the variation within the methylation values of the 1,696 CpGs, showed that samples were mostly separated by brain region (PC1), then by mouse strain (PC2) and only thirdly by age (PC3) (Figure 2G, 2H). Performing an unsupervised hierarchical clustering based on the methylation values of the 1,696 CpG-sites, similarly revealed a clear separation of the samples primarily based on brain region (Figure 2I). Thus, our analysis showed that despite the existence of overlapping CpG loci, the cortex and hippocampus display very different levels of DNA methylation of age-associated CpGs. Furthermore, based on a 3-way ANOVA analysis on the 1,696 CpGs we identified 59 CpGs that showed significantly (p-value <10E-5 for the interaction between strain and age) different age-associated methylation profiles between the mouse strains. These CpGs were found in clusters in the proximity of certain genes, namely 7 CpGs in Mir-219, 6 CpGs in Ntng2, 5 CpGs in Dlue2 and 2 CpGs in Coa6. For Mir-219, Ntng2 and Dlue2 methylation levels increased with age for the AD mice and decreased with age for the B6 mice. This is in contrast to Coa6, for which methylation levels decreased for the AD mice and increased for the B6 mice (Figure 3A). Finally, 157 CpGs were identified with different DNA methylation values (ANOVA p-value <10E-5 for strain) between AD and B6 mice (Figure 3B). Several of these CpG loci clustered in or near genes (Tshz3, Rapgefl1, Exoc3l2, Dapk1, Apoe and Hpcal1) that have been linked to AD in humans and/or mice (Figure 3C).
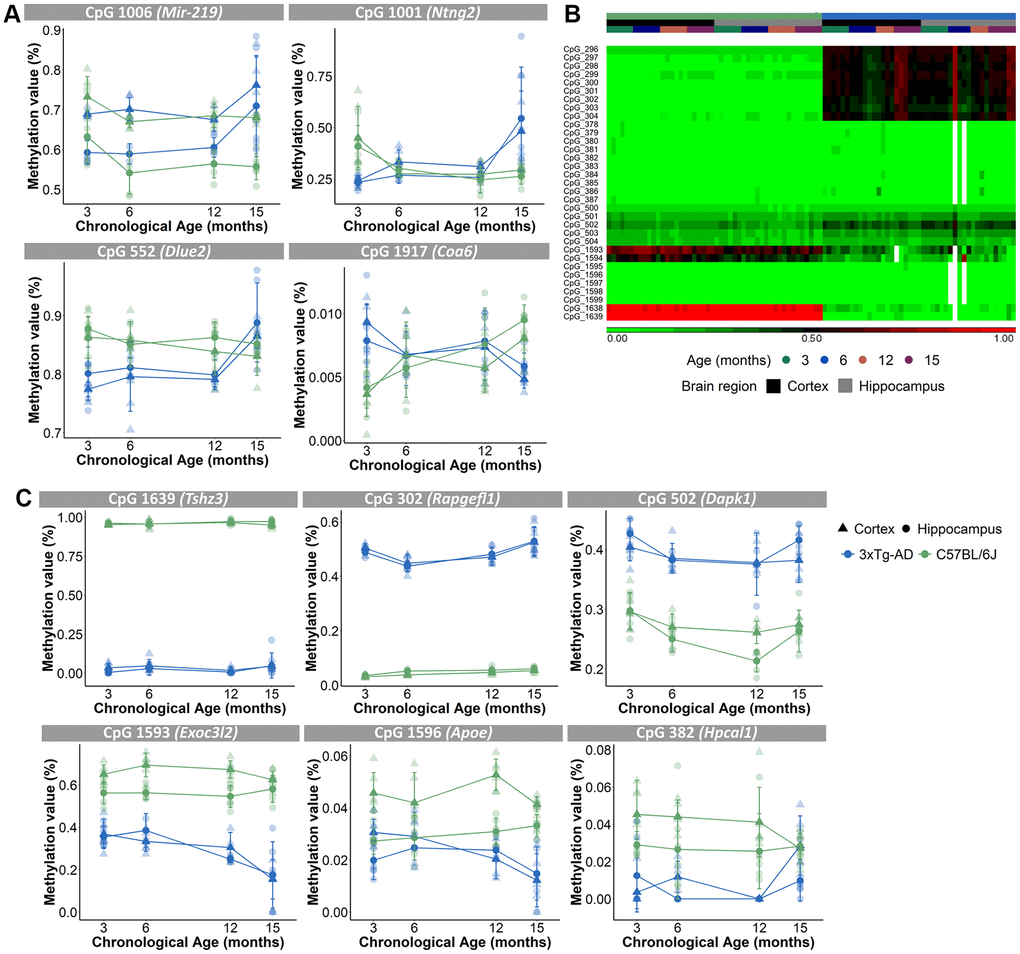
Figure 3. Different age-associated methylation profiles for AD mice compared to B6 mice. (A) Methylation profiles of CpGs in close proximity of Mir-219, Ntng2, Dlue2 and Coa6 genes for the cortex (triangles) and hippocampus (circles) were opposite for the AD (blue) and B6 (green) mice. N = 4. Mean ± SD. (B) Unsupervised hierarchical clustering using AD (blue) and B6 (green) mouse cortex (black) and hippocampus (grey) for 33 of the 157 CpG-sites that were differentially methylated for strain. (C) Methylation profiles for the cortex (triangles) and hippocampus (circles) of CpGs, associated with AD-related genes Tshz3, Rapgefl1, Dapk1, Exoc3l2, Apoe and Hpcal1 genes, show differing values between AD (blue) and B6 (green) mice.
The most significant age-associated CpGs cluster together in genomic regions important for developmental, aging-related and neuronal functions
In order to identify the CpGs that were mostly associated with age, we performed a 3-way ANOVA analysis on the 1,696 CpG-sites with brain region, mouse strain and age, as factors. To further investigate the most differentially methylated CpGs according to age, we selected 175 CpGs out of the 1,696 CpG-sites with a p-value for age <10E-4 (Figure 4A). Concerning the distribution of these CpGs among genomic features, we observed a slight shift towards more exon- and fewer intron-related CpGs (Figure 4B) as compared to the original 2,031 CpG-sites. A PCA performed on the 175 CpGs still showed a clear distinction of brain region (PC1) and strain (PC3) (Figure 4C). In addition, samples could now also be separated based on age (PC2) (Figure 4D) for both strains.
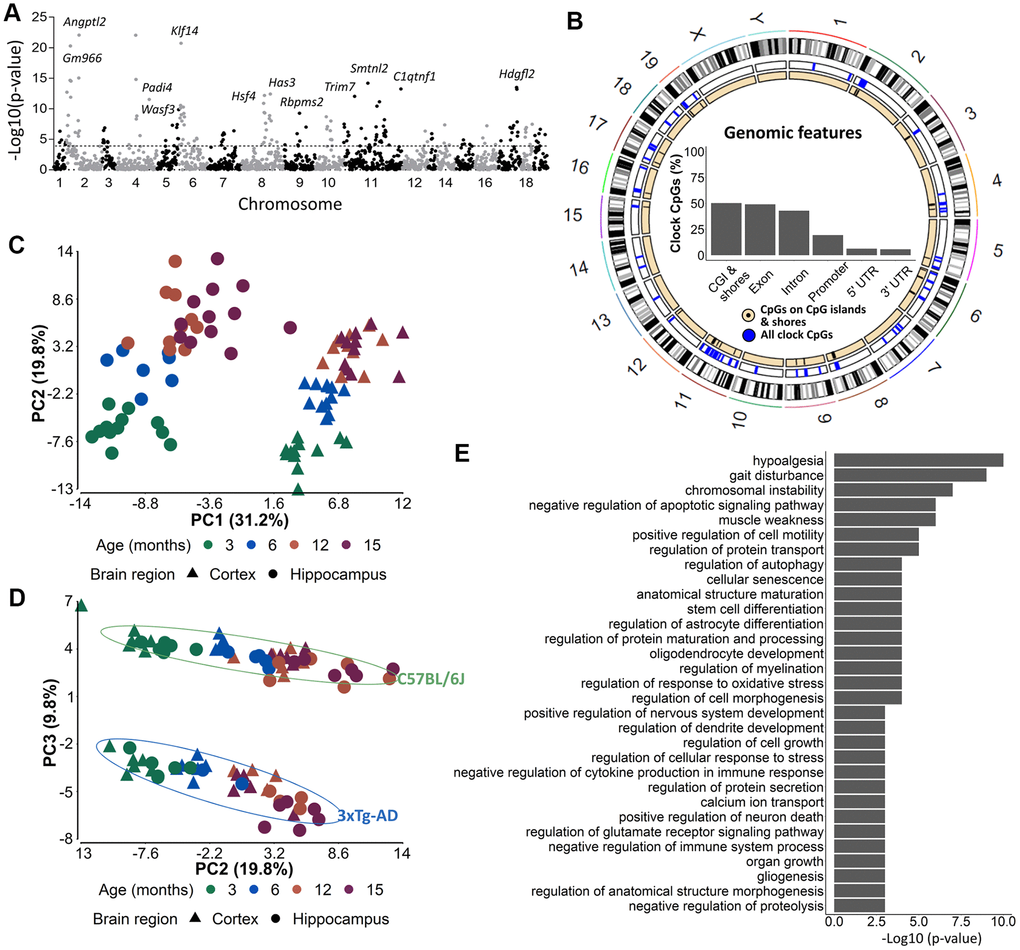
Figure 4. The 175 most significant age-associated CpGs cluster together in genomic regions important for developmental, aging-related and neuronal functions. (A) A Manhattan plot of the 1696 CpG-sites with 10E-4 as cut-off value indicating the 175 most significant age-associated CpGs. (B) Circos plots of genomic locations of the 175 CpGs in CpG-islands (black), and all clock CpG-sites (blue). Insets indicate relative distributions of clock CpG-sites across genomic features. (C, D) A principal component analysis (PCA) with (C) PC1 and PC2 and (D) PC2 and PC3 based on the DNA methylation value of 175 most significant age-associated CpGs in AD (blue) and B6 (green) mouse cortex (triangles) and hippocampus (circles). Age is colored by month. N = 6. (E) The GREAT analysis associated the 175 CpGs with a regulatory domain in the mouse genome.
We used the genomic regions enrichment of annotation tool (GREAT) [44] to assign biological meaning to the 175 most important age-associated CpG-sites that were related to 128 genes (Supplementary Table 3). Some of the genes were related to aging, e.g. Hsf4 and Klf14, to developmental processes, e.g. Tbx2 and Dmbx1, to synaptic plasticity, e.g. Srcin1, Calb2 and Neurl1a and to AD, e.g. Bin1. Among the biological processes that were enriched we found processes related to development (e.g. nervous system development, organ growth, gliogenesis), aging and age-related syndromes (e.g. hypoalgesia, gait disturbance, muscle weakness and cellular senescence), and neuronal/brain function (astrocyte differentiation, protein transport and secretion, dendrite development, glutamate receptor signaling, calcium ion transport) (Figure 4E). By using the UCSC genome brower’s LiftOver program, we could successfully convert 152 out of the 175 most significant age-associated CpG loci from the mouse (mm10) to human (hg19) genome assemblies [45], indicating high conservation of the loci. However, no overlap was found with the 513 CpG loci used in the phenoAge clock developed by Levine et al. used to correlate cortical epigenetic age and AD-related cognitive decline in humans [14].
Discussion
Compared to multi-tissue epigenetic clocks, tissue-specific clocks may be more suitable as indicators of disease-associated aging and may provide deeper insight into pathophysiological mechanisms, especially in cases where certain tissues are particularly affected [27]. One such disease is AD, an age-associated disease characterized by intracellular neurofibrillary tangles and the accumulation of amyloid-β plaques with aging as the major risk factor [46]. However, for obvious reasons it is not always possible to obtain tissue samples from humans. Therefore, we have generated in this study epigenetic clocks from cortex and hippocampus of a wild-type and an AD mouse model. To generate these clocks, we measured DNA methylation values of 2,031 CpGs using targeted bisulfite sequencing allowing 1000x coverage, which is several orders of magnitude higher than that of other studies [13, 18, 19]. We should acknowledge that even though we reached high coverage, missing values are still an inherent issue. However, as aging-related changes are pervasive in the DNA methylome [24], we are confident to have accurately captured the age-related variations in methylation values at the investigated CpGs. More than 100x coverage is required to obtain high-confidence differentially methylated positions [47].
The clocks we eventually developed consisted of 1, 144 and 732 CpGs for cortex and hippocampus, respectively, of which 436 overlapped. Despite this high overlap, both the methylation values of several individual CpGs as well as the epigenetic age predictions were very different between cortex and hippocampus. These differences may at least partly be explained by cell type heterogeneity (neuronal and non-neuronal) between both brain regions which are mostly marked by different pyramidal neuron subtypes and different ratios of mural, endothelial and glial cells [48, 49]. It can furthermore be anticipated that this heterogeneity is also influenced by changes in cellular composition during aging. For instance, the rates of adult neurogenesis and gliogenesis are higher in the hippocampus compared to the cortex [50] and may therefore result in a relative increase of biologically “younger” cells. This may contribute to our finding that the biological age of the hippocampus was lower than that of the cortex. However, although cell type-specific differences in DNA methylation patterns have recently been identified in the human and mouse frontal cortex [51], the genome-wide methylation patterns between neuronal and especially non-neuronal cells in the cortex and hippocampus were found to be very comparable in human post-mortem cortex and hippocampus [52]. We hypothesize that the observed distinct epigenetic age and age acceleration predictions may reflect enhanced biological aging of the cortex compared to the hippocampus in mice. This seems to be different in humans, where no difference in epigenetic age acceleration could be observed between different cortical regions and the hippocampus [53]. The reason for this discrepancy may be the selection of CpGs used to train the clocks. For the human study the Horvath clock was used [12] which was originally designed to perfectly predict chronological age.
The development of these epigenetic clocks specific for mouse cortex and hippocampus that were built from samples from a rather broad range of ages is important. Existing DNA clocks have been shown to work in general relatively well across different tissues, but underestimation of epigenetic age in older samples was particularly observed in brain [54]. A recently developed human cortical-specific DNA methylation clock outperformed the predictive accuracy for cortical age estimation in comparison with existing clocks designed for different tissues [55]. This indicates the need for tissue-specific epigenetic clocks, which may also better reflect tissue-specific changes in DNA methylation due to biological aging and therefore more accurately predict tissue-specific aging-related diseases.
Although both our clocks are able to estimate chronological age, they are not perfect. This is in fact essential in order to allow their use in predicting biological age, because by definition perfect chronological clocks cannot contain information on variation in biological age [56]. Indeed, there should be room for variability in order to generate biological aging associations [57]. It was proposed that epigenetic clocks specific for biological aging should focus on a defined aspect of the aging biology, including disease-related factors [27]. Here, we used AD mice to compare epigenetic aging of the cortex and hippocampus to that of non-pathological B6 mice over an extended period of their life. We found accelerated epigenetic aging for both brain regions in the AD mice, especially during early life, when also DNA methylation changes are most dynamic [10, 58]. It has been proposed that early-life changes in DNA methylation patterns may direct gene expression related to aging and age-related diseases later in life [59]. Therefore, the difference in DNA methylation observed at 3 months of age in the AD mice, which resulted in an increased estimated epigenetic age, could eventually participate to the increased aging phenotype observed with AD. In this respect, it is important to note that already at the age of 3 months, AD mice have started to develop aspects of the AD pathology. The presence of Aβ oligomers in the cortex can therefore potentially be related to the increase in epigenetic age. DNA methylation changes at certain CpG-sites were suggested to be linked to AD pathology [60]. As some of these epigenetic changes could be detected in presymptomatic subjects, it was proposed that they may have a role in the onset of AD [60].
Another possible explanation of this apparent epigenetic age acceleration of AD mice may be the difference in genetic background between the AD and B6 mice. However, previous research already demonstrated no epigenetic age acceleration when comparing different mouse strains [18, 19]. Moreover, this would not necessarily explain the differences we observed in age-associated DNA methylation between specific CpGs. Importantly, among the relatively few genes that showed opposite age-dependent DNA methylation profiles, several have shown to be related to neurodegenerative diseases and AD. For instance, we observed 7 CpGs in Mir-219 displaying an overall reduction in methylation with age in B6 mice, while being increased in AD mice. Mir-219 expression is known to be reduced in brains of AD patients [61], and suggested to promote neurodegeneration and disease progression [62]. A similar age-dependent methylation profile was observed for 5 CpGs in Dleu2. Also this gene is downregulated in the brain of human AD subjects [63]. CpGs near other AD-related genes, like Tshz3 [64], Rapgefl1 [65, 66], Exoc3l2 [67, 68], Dapk1 [69], Apoe [70] and Hpcal1 [71] were differentially methylated between B6 and AD mice. Furthermore, Other CpG loci contributing to our cortical and hippocampal clocks are proximal to the mouse orthologues of genes found to be differentially methylated in AD patients, including Bin1, Ezh1, Irx3, Rufy4, Dleu2 and Ddr1 [60, 72–74], indicating the translational potential of some of these epigenetic marks. Whether the differences in DNA methylation of these genes underlie variations in their expression that may subsequently affect AD pathology or neurodegeneration in the AD model needs to be further investigated.
Several of the CpGs we identified as being the most significantly differentially methylated with age were found to be associated with genes that either play a role in important neurological functions or are known to be related to neurodegeneration and AD. Hdgfl2, expressed by neurons, astrocytes and oligodendrocytes in adult mouse brain tissue, has a role in cell proliferation and cell survival [75]. Both Calb2 and Srcin1 function in synaptic plasticity [76–78]. Finally, Bin1 is identified as the second most important risk factor for late onset AD after ApoE, which itself contains 5 CpGs among the 2,031 used for the development of our clock. Bin1 modulates tau pathology and affects cellular functions like endocytosis, inflammation, calcium homeostasis and apoptosis [79, 80]. Although it is well known that DNA methylation in promoter regions influences gene expression [81], the link between age-dependent changes in methylation and gene expression is still unclear. For some genes a correlation has been identified, but this cannot be generalized [82]. Like DNA methylation, also gene expression is mostly regulated during the initial stages of postnatal life [83]. Therefore, it would be important to investigate a possible correlation between the transcriptome and the epigenome especially in young subjects.
We provide here the first epigenetic clocks for two mouse brain regions, based on DNA methylation data from young to old mice, and validated them using a healthy and pathological mouse strain. We believe that these clocks will be very useful for research on different neurological and neurodegenerative disorders that are, at least partly, initiated by epigenetic mechanisms.
Materials and Methods
Workflow
Zymo Research designed a DNAge® mouse epigenetic aging clock targeting 2,031 age-associated CpG loci. These epigenomic loci were identified using genome-wide reduced representation bisulfite sequencing (RRBS) using the Methyl-Midiseq method to select the most differentially methylated regions (DMRs) in blood samples from 12-, 24- and 64-week old male B6 mice. Blood has been proposed to be a good surrogate to study age-dependent DNA methylation profiles in the brain [84]. These in-house detected CpGs were furthermore supplemented with age-related CpG loci found after an extensive literature search [13, 17, 19, 36, 37]. The epigenetic clock was trained on two sample sets specific for hippocampus and cortex of the same male B6 mice from 12, 24 and 64 weeks of age. In the training phase, only male mice were used to exclude gender- and hormonal differences. Afterwards, the hippocampal and cortical epigenetic clocks were tested on a separate pool of hippocampal and cortical samples from male B6 mice of 24, 36, 70, 91 and 105 weeks of age. Finally, both clocks were used to determine biological age of female B6 and AD mice of 3, 6, 12 and 15 months of age.
Animals
The B6 mice were obtained from Janvier (Uden, The Netherlands). The AD mice contain two human transgenes, i.e. amyloid precursor protein (APPSwe) and microtubule-associated protein tau (tauP30IL), on a presenilin (PS1M146V) knock-in mice with a mixed B6;129/SvJ background, and were purchased from the Jackson Laboratory (California, USA). Full pathology of the AD mice is described by Oddo et al. [85] and revised by Belfiore et al. [86]. Female mice were bred and maintained in the animal facility of the nuclear research center SCK CEN under Specific pathogen Free (SPF) conditions and 12h light-dark cycle. Food (Altromin 1324, Carfill) and water were provided ad libitum. All animal experiments were performed in agreement with the Belgian laboratory animal legislation and the European Communities Council Directive (2010/63/EU) and approved by the Ethical Committee Animal Studies of the Medanex Clinic (EC_MxCl 2018-105).
Sample collection and processing
For the training and testing samples, cortex and hippocampus were collected from male B6 mice at different ages and stabilized for downstream processing using the DNA/RNA Shield™ reagent (Zymo Research). Genomic DNA was purified using the Quick-DNA™ Miniprep Plus kit (Cat. No. D4068). For the experimental samples, cortex and hippocampus were collected from female B6 and AD mice at different ages and immediately snap-frozen in liquid nitrogen. From the cortex and hippocampus of one brain hemisphere, genomic DNA was isolated using the QIAamp DNA mini kit (Qiagen). The genomic DNA was further processed to quantify DNAge®.
DNA methylation pre-processing
Sample library preparation and data analysis for mouse DNAge® were performed by the service provider (Zymo Research). Two-hundred ng of genomic DNA was bisulfite converted using EZ DNA Methylation-Lightning™ Kit (Zymo Research; Cat. No. D5030). Bisulfite-converted DNA libraries for targeted bisulfite sequencing platform, called SWARM® (Simplified Whole-panel Amplification Reaction Method) was prepared according the to the manufacturer’s instructions and were sequenced on a HiSeq 1500 sequencer for >1,000X coverage. Sequence reads were identified using Illumina base-calling software and aligned to the reference genome using Bismark [87–90], an aligner optimized for bisulfite sequence data and methylation calling. The methylation level of each sampled cytosine (DNA methylation value) was estimated as the number of reads reporting a C, divided by the total number of reads reporting a C or T. Thus, DNA methylation values range from 0 (completely un-methylated) to 1 (completely methylated).
DNAge® prediction
DNA methylation values of 2,031 age-related CpG loci were used for epigenetic age prediction using Zymo Research’s proprietary mouse DNAge® algorithms: A penalized regression model’s coefficients b0, b1, ..., bn related to transformed age as in equation (1):
(1) F(chronological age) = b0 + b1CpG1+ ⋯ + bnCpGn + error;
DNAge® was estimated as in equation (2):
(2) DNAge® = inverse.F(b0 + b1CpG1+ ⋯ +bnCpGn)
The ΔAge was calculated as in equation (3):
(3) ΔAge = DNAge® – chronological age.
Further analysis of age-associated CpGs
To obtain the distribution of the clock CpG-sites across genomic features, the annotatr R package was used at https://bioconductor.org/packages/release/bioc/vignettes/annotatr/inst/doc/annotatr-vignette.html. This package includes following CpG and genic annotations: CpG islands are the basis for all CpG annotations, and are given by the AnnotationHub package. CpG shores are defined as 2 kb upstream/downstream from the ends of the CpG islands, less the CpG islands, promoters defined as <1 kb upstream of the TSS, 5’UTR, exons, introns, coding sequence (CDS) of gene, 3’UTR and intergenic region. Enhancers were defined according to FANTOM5. Among the 2,031 CpG-sites some had missing values because of undetectable CpG loci due to failed enrichment of the amplicon or a lower DNA quality or DNA integrity. After discarding CpGs with missing values 1,696 CpG-sites remained for further analysis. From these, the 175 most significant age-associated CpG-sites were identified via 3-way ANOVA (p-value(age) <10E-4). These were used to identify enriched pathways using GREAT analysis [44] with default settings (Proximal: 5.0 kb upstream, 1.0 kb downstream, plus Distal: up to 1000 kb) and the 2,031 CpG sites as background regions. CpGs with a p-value <10E-5 for the interaction between age and strain, were considered to have significantly different age-dependent DNA methylation profiles between B6 and AD mice.
Statistical analysis
The predicted epigenetic ages of the B6 and AD mice, estimated by the epigenetic clocks specific for hippocampus and cortex were analyzed with linear-mixed models just like the resulting ΔAge. Only for the comparison of the mean ΔAge an unpaired student T-test was performed. The statistical outcomes of the linear-mixed models for Figure 2 and Supplementary Figure 1 are enclosed in Supplementary Table 4. All statistical analyses were performed in the R statistical environment (Version 3.6.1).
Supplementary Materials
Author Contributions
E.C., R.Q., and M.V. designed the study. E.C and A.C. designed and performed the experiments. E.C., Y.C.C., X.Y., W.G. and R.Q. analyzed the data. S.B. and L.V. acquired funding. E.C. and R.Q. wrote the draft manuscript. Y.C.C., X.Y., L.M., M.V. and R.Q. reviewed and edited the manuscript. All authors approved the submitted version.
Acknowledgments
The authors would like to acknowledge Lisa Daenen and Brit Proesmans for taking care of the mice, Mieke Neefs and Tatjana Verbeke for helping with the dissections and Emily Chen for technical assistance.
Conflicts of Interest
Y.C.C, X.Y. and W.G. are employees of Zymo Research Corporation. All other authors have no conflicts of interest to disclose.
Funding
Emma Coninx is funded by a joint doctoral SCK CEN/KU Leuven fellowship grant.
References
- 1. Niccoli T, Partridge L. Ageing as a risk factor for disease. Curr Biol. 2012; 22:R741–52. https://doi.org/10.1016/j.cub.2012.07.024 [PubMed]
- 2. López-Otín C, Blasco MA, Partridge L, Serrano M, Kroemer G. The hallmarks of aging. Cell. 2013; 153:1194–217. https://doi.org/10.1016/j.cell.2013.05.039 [PubMed]
- 3. Partridge L, Deelen J, Slagboom PE. Facing up to the global challenges of ageing. Nature. 2018; 561:45–56. https://doi.org/10.1038/s41586-018-0457-8 [PubMed]
- 4. Campisi J, Kapahi P, Lithgow GJ, Melov S, Newman JC, Verdin E. From discoveries in ageing research to therapeutics for healthy ageing. Nature. 2019; 571:183–92. https://doi.org/10.1038/s41586-019-1365-2 [PubMed]
- 5. Jylhävä J, Pedersen NL, Hägg S. Biological age predictors. EBioMedicine. 2017; 21:29–36. https://doi.org/10.1016/j.ebiom.2017.03.046 [PubMed]
- 6. Brunet A, Berger SL. Epigenetics of aging and aging-related disease. J Gerontol A Biol Sci Med Sci. 2014 (Suppl 1); 69:S17–20. https://doi.org/10.1093/gerona/glu042 [PubMed]
- 7. Delgado-Morales R, Agís-Balboa RC, Esteller M, Berdasco M. Epigenetic mechanisms during ageing and neurogenesis as novel therapeutic avenues in human brain disorders. Clin Epigenetics. 2017; 9:67. https://doi.org/10.1186/s13148-017-0365-z [PubMed]
- 8. Moore LD, Le T, Fan G. DNA methylation and its basic function. Neuropsychopharmacology. 2013; 38:23–38. https://doi.org/10.1038/npp.2012.112 [PubMed]
- 9. Sen P, Shah PP, Nativio R, Berger SL. Epigenetic mechanisms of longevity and aging. Cell. 2016; 166:822–39. https://doi.org/10.1016/j.cell.2016.07.050 [PubMed]
- 10. Lister R, Mukamel EA, Nery JR, Urich M, Puddifoot CA, Johnson ND, Lucero J, Huang Y, Dwork AJ, Schultz MD, Yu M, Tonti-Filippini J, Heyn H, et al. Global epigenomic reconfiguration during mammalian brain development. Science. 2013; 341:1237905. https://doi.org/10.1126/science.1237905 [PubMed]
- 11. Bocklandt S, Lin W, Sehl ME, Sánchez FJ, Sinsheimer JS, Horvath S, Vilain E. Epigenetic predictor of age. PLoS One. 2011; 6:e14821. https://doi.org/10.1371/journal.pone.0014821 [PubMed]
- 12. Horvath S. DNA methylation age of human tissues and cell types. Genome Biol. 2013; 14:R115. https://doi.org/10.1186/gb-2013-14-10-r115 [PubMed]
- 13. Stubbs TM, Bonder MJ, Stark AK, Krueger F, von Meyenn F, Stegle O, Reik W, and BI Ageing Clock Team. Multi-tissue DNA methylation age predictor in mouse. Genome Biol. 2017; 18:68. https://doi.org/10.1186/s13059-017-1203-5 [PubMed]
- 14. Levine ME, Lu AT, Quach A, Chen BH, Assimes TL, Bandinelli S, Hou L, Baccarelli AA, Stewart JD, Li Y, Whitsel EA, Wilson JG, Reiner AP, et al. An epigenetic biomarker of aging for lifespan and healthspan. Aging (Albany NY). 2018; 10:573–91. https://doi.org/10.18632/aging.101414 [PubMed]
- 15. Yang Z, Wong A, Kuh D, Paul DS, Rakyan VK, Leslie RD, Zheng SC, Widschwendter M, Beck S, Teschendorff AE. Correlation of an epigenetic mitotic clock with cancer risk. Genome Biol. 2016; 17:205. https://doi.org/10.1186/s13059-016-1064-3 [PubMed]
- 16. Zhang Y, Wilson R, Heiss J, Breitling LP, Saum KU, Schöttker B, Holleczek B, Waldenberger M, Peters A, Brenner H. DNA methylation signatures in peripheral blood strongly predict all-cause mortality. Nat Commun. 2017; 8:14617. https://doi.org/10.1038/ncomms14617 [PubMed]
- 17. Thompson MJ, Chwiałkowska K, Rubbi L, Lusis AJ, Davis RC, Srivastava A, Korstanje R, Churchill GA, Horvath S, Pellegrini M. A multi-tissue full lifespan epigenetic clock for mice. Aging (Albany NY). 2018; 10:2832–54. https://doi.org/10.18632/aging.101590 [PubMed]
- 18. Petkovich DA, Podolskiy DI, Lobanov AV, Lee SG, Miller RA, Gladyshev VN. Using DNA methylation profiling to evaluate biological age and longevity interventions. Cell Metab. 2017; 25:954–60.e6. https://doi.org/10.1016/j.cmet.2017.03.016 [PubMed]
- 19. Wang T, Tsui B, Kreisberg JF, Robertson NA, Gross AM, Yu MK, Carter H, Brown-Borg HM, Adams PD, Ideker T. Epigenetic aging signatures in mice livers are slowed by dwarfism, calorie restriction and rapamycin treatment. Genome Biol. 2017; 18:57. https://doi.org/10.1186/s13059-017-1186-2 [PubMed]
- 20. Marioni RE, Shah S, McRae AF, Chen BH, Colicino E, Harris SE, Gibson J, Henders AK, Redmond P, Cox SR, Pattie A, Corley J, Murphy L, et al. DNA methylation age of blood predicts all-cause mortality in later life. Genome Biol. 2015; 16:25. https://doi.org/10.1186/s13059-015-0584-6 [PubMed]
- 21. Horvath S, Ritz BR. Increased epigenetic age and granulocyte counts in the blood of Parkinson’s disease patients. Aging (Albany NY). 2015; 7:1130–42. https://doi.org/10.18632/aging.100859 [PubMed]
- 22. Chen BH, Marioni RE, Colicino E, Peters MJ, Ward-Caviness CK, Tsai PC, Roetker NS, Just AC, Demerath EW, Guan W, Bressler J, Fornage M, Studenski S, et al. DNA methylation-based measures of biological age: meta-analysis predicting time to death. Aging (Albany NY). 2016; 8:1844–65. https://doi.org/10.18632/aging.101020 [PubMed]
- 23. Horvath S, Raj K. DNA methylation-based biomarkers and the epigenetic clock theory of ageing. Nat Rev Genet. 2018; 19:371–84. https://doi.org/10.1038/s41576-018-0004-3 [PubMed]
- 24. Hannum G, Guinney J, Zhao L, Zhang L, Hughes G, Sadda S, Klotzle B, Bibikova M, Fan JB, Gao Y, Deconde R, Chen M, Rajapakse I, et al. Genome-wide methylation profiles reveal quantitative views of human aging rates. Mol Cell. 2013; 49:359–67. https://doi.org/10.1016/j.molcel.2012.10.016 [PubMed]
- 25. Christensen BC, Houseman EA, Marsit CJ, Zheng S, Wrensch MR, Wiemels JL, Nelson HH, Karagas MR, Padbury JF, Bueno R, Sugarbaker DJ, Yeh RF, Wiencke JK, Kelsey KT. Aging and environmental exposures alter tissue-specific DNA methylation dependent upon CpG island context. PLoS Genet. 2009; 5:e1000602. https://doi.org/10.1371/journal.pgen.1000602 [PubMed]
- 26. Horvath S, Oshima J, Martin GM, Lu AT, Quach A, Cohen H, Felton S, Matsuyama M, Lowe D, Kabacik S, Wilson JG, Reiner AP, Maierhofer A, et al. Epigenetic clock for skin and blood cells applied to Hutchinson gilford progeria syndrome and ex vivo studies. Aging (Albany NY). 2018; 10:1758–75. https://doi.org/10.18632/aging.101508 [PubMed]
- 27. Bell CG, Lowe R, Adams PD, Baccarelli AA, Beck S, Bell JT, Christensen BC, Gladyshev VN, Heijmans BT, Horvath S, Ideker T, Issa JJ, Kelsey KT, et al. DNA methylation aging clocks: challenges and recommendations. Genome Biol. 2019; 20:249. https://doi.org/10.1186/s13059-019-1824-y [PubMed]
- 28. Bernstein BE, Stamatoyannopoulos JA, Costello JF, Ren B, Milosavljevic A, Meissner A, Kellis M, Marra MA, Beaudet AL, Ecker JR, Farnham PJ, Hirst M, Lander ES, et al. The NIH roadmap epigenomics mapping consortium. Nat Biotechnol. 2010; 28:1045–48. https://doi.org/10.1038/nbt1010-1045 [PubMed]
- 29. Illingworth R, Kerr A, Desousa D, Jørgensen H, Ellis P, Stalker J, Jackson D, Clee C, Plumb R, Rogers J, Humphray S, Cox T, Langford C, Bird A. A novel CpG island set identifies tissue-specific methylation at developmental gene loci. PLoS Biol. 2008; 6:e22. https://doi.org/10.1371/journal.pbio.0060022 [PubMed]
- 30. Han Y, Eipel M, Franzen J, Sakk V, Dethmers-Ausema B, Yndriago L, Izeta A, de Haan G, Geiger H, Wagner W. Epigenetic age-predictor for mice based on three CpG sites. Elife. 2018; 7:e37462. https://doi.org/10.7554/eLife.37462 [PubMed]
- 31. Hayano M, Yang JH, Bonkowski MS, Amorim JA, Ross JM, Coppotelli G, Griffin PT, Chew YC, Guo W, Yang X, Vera DL, Salfati EL, Das A, et al. DNA Break-Induced Epigenetic Drift as a Cause of Mammalian Aging. bioRxiv. 2019: 808659. https://doi.org/10.2139/ssrn.3466338
- 32. World Health Organization. Dementia Fact Sheet. 2020. https://www.who.int/news-room/fact-sheets/detail/dementia.
- 33. Levine ME, Lu AT, Bennett DA, Horvath S. Epigenetic age of the pre-frontal cortex is associated with neuritic plaques, amyloid load, and Alzheimer’s disease related cognitive functioning. Aging (Albany NY). 2015; 7:1198–211. https://doi.org/10.18632/aging.100864 [PubMed]
- 34. Chen XQ, Mobley WC. Alzheimer disease pathogenesis: insights from molecular and cellular biology studies of oligomeric Aβ and tau species. Front Neurosci. 2019; 13:659. https://doi.org/10.3389/fnins.2019.00659 [PubMed]
- 35. McCartney DL, Stevenson AJ, Walker RM, Gibson J, Morris SW, Campbell A, Murray AD, Whalley HC, Porteous DJ, McIntosh AM, Evans KL, Deary IJ, Marioni RE. Investigating the relationship between DNA methylation age acceleration and risk factors for Alzheimer’s disease. Alzheimers Dement (Amst). 2018; 10:429–37. https://doi.org/10.1016/j.dadm.2018.05.006 [PubMed]
- 36. Cole JJ, Robertson NA, Rather MI, Thomson JP, McBryan T, Sproul D, Wang T, Brock C, Clark W, Ideker T, Meehan RR, Miller RA, Brown-Borg HM, Adams PD. Diverse interventions that extend mouse lifespan suppress shared age-associated epigenetic changes at critical gene regulatory regions. Genome Biol. 2017; 18:58. https://doi.org/10.1186/s13059-017-1185-3 [PubMed]
- 37. Meer MV, Podolskiy DI, Tyshkovskiy A, Gladyshev VN. A whole lifespan mouse multi-tissue DNA methylation clock. Elife. 2018; 7:e40675. https://doi.org/10.7554/eLife.40675 [PubMed]
- 38. Bird AP. CpG-rich islands and the function of DNA methylation. Nature. 1986; 321:209–13. https://doi.org/10.1038/321209a0 [PubMed]
- 39. Detrez JR, Maurin H, Van Kolen K, Willems R, Colombelli J, Lechat B, Roucourt B, Van Leuven F, Baatout S, Larsen P, Nuydens R, Timmermans JP, De Vos WH. Regional vulnerability and spreading of hyperphosphorylated tau in seeded mouse brain. Neurobiol Dis. 2019; 127:398–409. https://doi.org/10.1016/j.nbd.2019.03.010 [PubMed]
- 40. Hirata-Fukae C, Li HF, Hoe HS, Gray AJ, Minami SS, Hamada K, Niikura T, Hua F, Tsukagoshi-Nagai H, Horikoshi-Sakuraba Y, Mughal M, Rebeck GW, LaFerla FM, et al. Females exhibit more extensive amyloid, but not tau, pathology in an Alzheimer transgenic model. Brain Res. 2008; 1216:92–103. https://doi.org/10.1016/j.brainres.2008.03.079 [PubMed]
- 41. Carroll JC, Rosario ER, Kreimer S, Villamagna A, Gentzschein E, Stanczyk FZ, Pike CJ. Sex differences in β-amyloid accumulation in 3xTg-AD mice: role of neonatal sex steroid hormone exposure. Brain Res. 2010; 1366:233–45. https://doi.org/10.1016/j.brainres.2010.10.009 [PubMed]
- 42. Kane AE, Shin S, Wong AA, Fertan E, Faustova NS, Howlett SE, Brown RE. Sex differences in healthspan predict lifespan in the 3xTg-AD mouse model of Alzheimer’s disease. Front Aging Neurosci. 2018; 10:172. https://doi.org/10.3389/fnagi.2018.00172 [PubMed]
- 43. Turturro A, Duffy P, Hass B, Kodell R, Hart R. Survival characteristics and age-adjusted disease incidences in C57BL/6 mice fed a commonly used cereal-based diet modulated by dietary restriction. J Gerontol A Biol Sci Med Sci. 2002; 57:B379–89. https://doi.org/10.1093/gerona/57.11.b379 [PubMed]
- 44. McLean CY, Bristor D, Hiller M, Clarke SL, Schaar BT, Lowe CB, Wenger AM, Bejerano G. GREAT improves functional interpretation of cis-regulatory regions. Nat Biotechnol. 2010; 28:495–501. https://doi.org/10.1038/nbt.1630 [PubMed]
- 45. Kuhn RM, Haussler D, Kent WJ. The UCSC genome browser and associated tools. Brief Bioinform. 2013; 14:144–61. https://doi.org/10.1093/bib/bbs038 [PubMed]
- 46. Edwards Iii GA, Gamez N, Escobedo G
Jr , Calderon O, Moreno-Gonzalez I. Modifiable risk factors for Alzheimer’s disease. Front Aging Neurosci. 2019; 11:146. https://doi.org/10.3389/fnagi.2019.00146 [PubMed] - 47. Libertini E, Heath SC, Hamoudi RA, Gut M, Ziller MJ, Herrero J, Czyz A, Ruotti V, Stunnenberg HG, Frontini M, Ouwehand WH, Meissner A, Gut IG, Beck S. Saturation analysis for whole-genome bisulfite sequencing data. Nat Biotechnol. 2016; 34:691–93. https://doi.org/10.1038/nbt.3524 [PubMed]
- 48. Zeisel A, Muñoz-Manchado AB, Codeluppi S, Lönnerberg P, La Manno G, Juréus A, Marques S, Munguba H, He L, Betsholtz C, Rolny C, Castelo-Branco G, Hjerling-Leffler J, Linnarsson S. Brain structure. Cell types in the mouse cortex and hippocampus revealed by single-cell RNA-seq. Science. 2015; 347:1138–42. https://doi.org/10.1126/science.aaa1934 [PubMed]
- 49. McKenzie AT, Wang M, Hauberg ME, Fullard JF, Kozlenkov A, Keenan A, Hurd YL, Dracheva S, Casaccia P, Roussos P, Zhang B. Brain cell type specific gene expression and co-expression network architectures. Sci Rep. 2018; 8:8868. https://doi.org/10.1038/s41598-018-27293-5 [PubMed]
- 50. Rusznák Z, Henskens W, Schofield E, Kim WS, Fu Y. Adult neurogenesis and gliogenesis: possible mechanisms for neurorestoration. Exp Neurobiol. 2016; 25:103–12. https://doi.org/10.5607/en.2016.25.3.103 [PubMed]
- 51. Luo C, Keown CL, Kurihara L, Zhou J, He Y, Li J, Castanon R, Lucero J, Nery JR, Sandoval JP, Bui B, Sejnowski TJ, Harkins TT, et al. Single-cell methylomes identify neuronal subtypes and regulatory elements in mammalian cortex. Science. 2017; 357:600–04. https://doi.org/10.1126/science.aan3351 [PubMed]
- 52. Rizzardi LF, Hickey PF, Rodriguez DiBlasi V, Tryggvadóttir R, Callahan CM, Idrizi A, Hansen KD, Feinberg AP. Neuronal brain-region-specific DNA methylation and chromatin accessibility are associated with neuropsychiatric trait heritability. Nat Neurosci. 2019; 22:307–16. https://doi.org/10.1038/s41593-018-0297-8 [PubMed]
- 53. Horvath S, Mah V, Lu AT, Woo JS, Choi OW, Jasinska AJ, Riancho JA, Tung S, Coles NS, Braun J, Vinters HV, Coles LS. The cerebellum ages slowly according to the epigenetic clock. Aging (Albany NY). 2015; 7:294–306. https://doi.org/10.18632/aging.100742 [PubMed]
- 54. El Khoury LY, Gorrie-Stone T, Smart M, Hughes A, Bao Y, Andrayas A, Burrage J, Hannon E, Kumari M, Mill J, Schalkwyk LC. Systematic underestimation of the epigenetic clock and age acceleration in older subjects. Genome Biol. 2019; 20:283. https://doi.org/10.1186/s13059-019-1810-4 [PubMed]
- 55. Shireby GL, Davies JP, Francis PT, Burrage J, Walker EM, Neilson GWA, Dahir A, Thomas AJ, Love S, Smith RG, Lunnon K, Kumari M, Schalkwyk LC, et al. Recalibrating the Epigenetic Clock: Implications for Assessing Biological Age in the Human Cortex. bioRxiv. 2020. https://www.biorxiv.org/content/10.1101/2020.04.27.063719v1.
- 56. Field AE, Robertson NA, Wang T, Havas A, Ideker T, Adams PD. DNA methylation clocks in aging: categories, causes, and consequences. Mol Cell. 2018; 71:882–95. https://doi.org/10.1016/j.molcel.2018.08.008 [PubMed]
- 57. Zhang Q, Vallerga CL, Walker RM, Lin T, Henders AK, Montgomery GW, He J, Fan D, Fowdar J, Kennedy M, Pitcher T, Pearson J, Halliday G, et al. Improved precision of epigenetic clock estimates across tissues and its implication for biological ageing. Genome Med. 2019; 11:54. https://doi.org/10.1186/s13073-019-0667-1 [PubMed]
- 58. He Y, Hariharan M, Gorkin DU, Dickel DE, Luo C, Castanon RG, Nery JR, Lee AY, Zhao Y, Huang H, Williams BA, Trout D, Amrhein H, et al. Spatiotemporal DNA methylome dynamics of the developing mouse fetus. Nature. 2020; 583:752–59. https://doi.org/10.1038/s41586-020-2119-x [PubMed]
- 59. Hadad N, Masser DR, Blanco-Berdugo L, Stanford DR, Freeman WM. Early-life DNA methylation profiles are indicative of age-related transcriptome changes. Epigenetics Chromatin. 2019; 12:58. https://doi.org/10.1186/s13072-019-0306-5 [PubMed]
- 60. De Jager PL, Srivastava G, Lunnon K, Burgess J, Schalkwyk LC, Yu L, Eaton ML, Keenan BT, Ernst J, McCabe C, Tang A, Raj T, Replogle J, et al. Alzheimer’s disease: early alterations in brain DNA methylation at ANK1, BIN1, RHBDF2 and other loci. Nat Neurosci. 2014; 17:1156–63. https://doi.org/10.1038/nn.3786 [PubMed]
- 61. Santa-Maria I, Alaniz ME, Renwick N, Cela C, Fulga TA, Van Vactor D, Tuschl T, Clark LN, Shelanski ML, McCabe BD, Crary JF. Dysregulation of microRNA-219 promotes neurodegeneration through post-transcriptional regulation of tau. J Clin Invest. 2015; 125:681–86. https://doi.org/10.1172/JCI78421 [PubMed]
- 62. Arnes M, Kim YA, Lannes J, Alaniz ME, Cho JD, McCabe BD, Santa-Maria I. MiR-219 deficiency in Alzheimer’s disease contributes to neurodegeneration and memory dysfunction through post-transcriptional regulation of tau-kinase network. bioRxiv. 2019. https://doi.org/10.1101/607176
- 63. Parsi S, Smith PY, Goupil C, Dorval V, Hébert SS. Preclinical evaluation of miR-15/107 family members as multifactorial drug targets for Alzheimer’s disease. Mol Ther Nucleic Acids. 2015; 4:e256. https://doi.org/10.1038/mtna.2015.33 [PubMed]
- 64. Kajiwara Y, Akram A, Katsel P, Haroutunian V, Schmeidler J, Beecham G, Haines JL, Pericak-Vance MA, Buxbaum JD. FE65 binds teashirt, inhibiting expression of the primate-specific caspase-4. PLoS One. 2009; 4:e5071. https://doi.org/10.1371/journal.pone.0005071 [PubMed]
- 65. Blalock EM, Geddes JW, Chen KC, Porter NM, Markesbery WR, Landfield PW. Incipient Alzheimer’s disease: microarray correlation analyses reveal major transcriptional and tumor suppressor responses. Proc Natl Acad Sci USA. 2004; 101:2173–78. https://doi.org/10.1073/pnas.0308512100 [PubMed]
- 66. Tseveleki V, Rubio R, Vamvakas SS, White J, Taoufik E, Petit E, Quackenbush J, Probert L. Comparative gene expression analysis in mouse models for multiple sclerosis, Alzheimer’s disease and stroke for identifying commonly regulated and disease-specific gene changes. Genomics. 2010; 96:82–91. https://doi.org/10.1016/j.ygeno.2010.04.004 [PubMed]
- 67. Wu QJ, Sun SY, Yan CJ, Cheng ZC, Yang MF, Li ZF, Cheng HW, Fang TK. EXOC3L2 rs597668 variant contributes to Alzheimer’s disease susceptibility in Asian population. Oncotarget. 2017; 8:20086–91. https://doi.org/10.18632/oncotarget.15380 [PubMed]
- 68. Shang H, Fu J, Zhang XM, Song RR, Wang WZ. Association between EXOC3L2 rs597668 polymorphism and Alzheimer’s disease. CNS Neurosci Ther. 2013; 19:834–39. https://doi.org/10.1111/cns.12119 [PubMed]
- 69. Xu LZ, Li BQ, Jia JP. DAPK1: a novel pathology and treatment target for Alzheimer’s disease. Mol Neurobiol. 2019; 56:2838–44. https://doi.org/10.1007/s12035-018-1242-2 [PubMed]
- 70. Yamazaki Y, Zhao N, Caulfield TR, Liu CC, Bu G. Apolipoprotein E and Alzheimer disease: pathobiology and targeting strategies. Nat Rev Neurol. 2019; 15:501–18. https://doi.org/10.1038/s41582-019-0228-7 [PubMed]
- 71. Hokama M, Oka S, Leon J, Ninomiya T, Honda H, Sasaki K, Iwaki T, Ohara T, Sasaki T, LaFerla FM, Kiyohara Y, Nakabeppu Y. Altered expression of diabetes-related genes in Alzheimer’s disease brains: the Hisayama study. Cereb Cortex. 2014; 24:2476–88. https://doi.org/10.1093/cercor/bht101 [PubMed]
- 72. Altuna M, Urdánoz-Casado A, Sánchez-Ruiz de Gordoa J, Zelaya MV, Labarga A, Lepesant JM, Roldán M, Blanco-Luquin I, Perdones Á, Larumbe R, Jericó I, Echavarri C, Méndez-López I, et al. DNA methylation signature of human hippocampus in Alzheimer’s disease is linked to neurogenesis. Clin Epigenetics. 2019; 11:91. https://doi.org/10.1186/s13148-019-0672-7 [PubMed]
- 73. Smith RG, Pishva E, Shireby G, Smith AR, Roubroeks JAY, Hannon E, Wheildon G, Mastroeni D, Gasparoni G, Riemenschneider M, Giese A, Sharp AJ, Schalkwyk L, et al. Meta-analysis of epigenome-wide association studies in Alzheimer’s disease highlights 220 differentially methylated loci across cortex. bioRxiv. 2020. https://doi.org/10.1101/2020.02.28.957894
- 74. Yu L, Chibnik LB, Srivastava GP, Pochet N, Yang J, Xu J, Kozubek J, Obholzer N, Leurgans SE, Schneider JA, Meissner A, De Jager PL, Bennett DA. Association of brain DNA methylation in SORL1, ABCA7, HLA-DRB5, SLC24A4, and BIN1 with pathological diagnosis of Alzheimer disease. JAMA Neurol. 2015; 72:15–24. https://doi.org/10.1001/jamaneurol.2014.3049 [PubMed]
- 75. El-Tahir HM, Dietz F, Dringen R, Schwabe K, Strenge K, Kelm S, Abouzied MM, Gieselmann V, Franken S. Expression of hepatoma-derived growth factor family members in the adult central nervous system. BMC Neurosci. 2006; 7:6. https://doi.org/10.1186/1471-2202-7-6 [PubMed]
- 76. Camp AJ, Wijesinghe R. Calretinin: modulator of neuronal excitability. Int J Biochem Cell Biol. 2009; 41:2118–21. https://doi.org/10.1016/j.biocel.2009.05.007 [PubMed]
- 77. Li MY, Miao WY, Wu QZ, He SJ, Yan G, Yang Y, Liu JJ, Taketo MM, Yu X. A critical role of presynaptic cadherin/catenin/p140Cap complexes in stabilizing spines and functional synapses in the neocortex. Neuron. 2017; 94:1155–72.e8. https://doi.org/10.1016/j.neuron.2017.05.022 [PubMed]
- 78. Pavlopoulos E, Trifilieff P, Chevaleyre V, Fioriti L, Zairis S, Pagano A, Malleret G, Kandel ER. Neuralized1 activates CPEB3: a function for nonproteolytic ubiquitin in synaptic plasticity and memory storage. Cell. 2011; 147:1369–83. https://doi.org/10.1016/j.cell.2011.09.056 [PubMed]
- 79. Tan MS, Yu JT, Tan L. Bridging integrator 1 (BIN1): form, function, and Alzheimer’s disease. Trends Mol Med. 2013; 19:594–603. https://doi.org/10.1016/j.molmed.2013.06.004 [PubMed]
- 80. Salcedo-Tacuma D, Melgarejo JD, Mahecha MF, Ortega-Rojas J, Arboleda-Bustos CE, Pardo-Turriago R, Arboleda H. Differential methylation levels in CpGs of the BIN1 gene in individuals with Alzheimer disease. Alzheimer Dis Assoc Disord. 2019; 33:321–26. https://doi.org/10.1097/WAD.0000000000000329 [PubMed]
- 81. Bird TD. Genetic factors in Alzheimer’s disease. N Engl J Med. 2005; 352:862–64. https://doi.org/10.1056/NEJMp058027 [PubMed]
- 82. Unnikrishnan A, Freeman WM, Jackson J, Wren JD, Porter H, Richardson A. The role of DNA methylation in epigenetics of aging. Pharmacol Ther. 2019; 195:172–85. https://doi.org/10.1016/j.pharmthera.2018.11.001 [PubMed]
- 83. Cardoso-Moreira M, Halbert J, Valloton D, Velten B, Chen C, Shao Y, Liechti A, Ascenção K, Rummel C, Ovchinnikova S, Mazin PV, Xenarios I, Harshman K, et al. Gene expression across mammalian organ development. Nature. 2019; 571:505–09. https://doi.org/10.1038/s41586-019-1338-5 [PubMed]
- 84. Horvath S, Zhang Y, Langfelder P, Kahn RS, Boks MP, van Eijk K, van den Berg LH, Ophoff RA. Aging effects on DNA methylation modules in human brain and blood tissue. Genome Biol. 2012; 13:R97. https://doi.org/10.1186/gb-2012-13-10-r97 [PubMed]
- 85. Oddo S, Caccamo A, Shepherd JD, Murphy MP, Golde TE, Kayed R, Metherate R, Mattson MP, Akbari Y, LaFerla FM. Triple-transgenic model of Alzheimer’s disease with plaques and tangles: intracellular abeta and synaptic dysfunction. Neuron. 2003; 39:409–21. https://doi.org/10.1016/s0896-6273(03)00434-3 [PubMed]
- 86. Belfiore R, Rodin A, Ferreira E, Velazquez R, Branca C, Caccamo A, Oddo S. Temporal and regional progression of Alzheimer’s disease-like pathology in 3xTg-AD mice. Aging Cell. 2019; 18:e12873. https://doi.org/10.1111/acel.12873 [PubMed]
- 87. Arechederra M, Daian F, Yim A, Bazai SK, Richelme S, Dono R, Saurin AJ, Habermann BH, Maina F. Publisher correction: hypermethylation of gene body CpG islands predicts high dosage of functional oncogenes in liver cancer. Nat Commun. 2018; 9:3976. https://doi.org/10.1038/s41467-018-06482-w [PubMed]
- 88. Xie K, Ryan DP, Pearson BL, Henzel KS, Neff F, Vidal RO, Hennion M, Lehmann I, Schleif M, Schröder S, Adler T, Rathkolb B, Rozman J, et al. Epigenetic alterations in longevity regulators, reduced life span, and exacerbated aging-related pathology in old father offspring mice. Proc Natl Acad Sci USA. 2018; 115:E2348–57. https://doi.org/10.1073/pnas.1707337115 [PubMed]
- 89. vonHoldt BM, Ji SS, Aardema ML, Stahler DR, Udell MA, Sinsheimer JS. Activity of genes with functions in human williams-beuren syndrome is impacted by mobile element insertions in the gray wolf genome. Genome Biol Evol. 2018; 10:1546–53. https://doi.org/10.1093/gbe/evy112 [PubMed]
- 90. Jones CM, Lim KS, Chapman JW, Bass C. Genome-wide characterization of DNA methylation in an invasive lepidopteran pest, the cotton bollworm Helicoverpa armigera. G3 (Bethesda). 2018; 8:779–87. https://doi.org/10.1534/g3.117.1112 [PubMed]