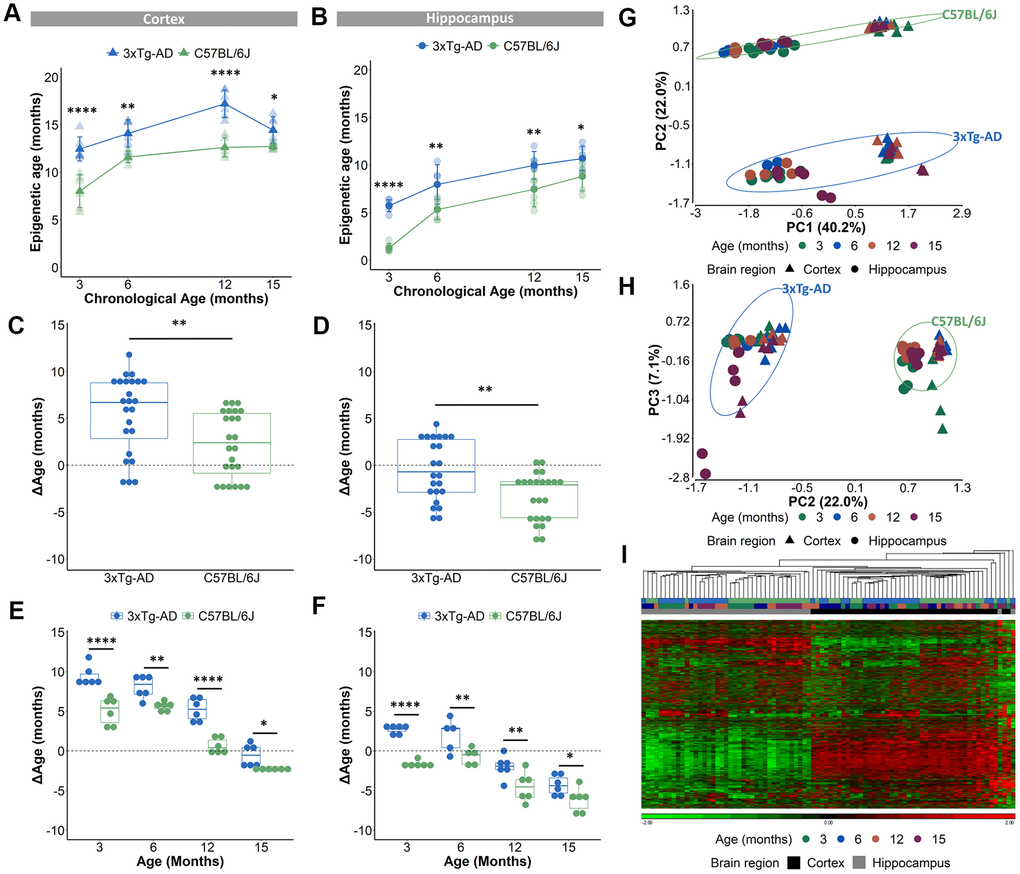
Figure 2.Acceleration of epigenetic age in AD mice compared to B6 mice in cortical and hippocampal tissue. (A, B) The predicted epigenetic age for cortex (A) and hippocampus (B) of AD (blue) and B6 (green) mice. Mean ± SD. (C, D) The mean ΔAge and (E, F) the ΔAge per chronological time point for cortex and hippocampus of AD (blue) and B6 (green) mice. N = 6. * p < 0.05, ** p < 0.01, **** p < 0.0001. (G, H) A principal component analysis (PCA) with PC1 and PC2 (G) and PC2 and PC3 (H) based on the DNA methylation value of 1696 CpGs in AD (blue) and B6 (green) mouse cortex (triangles) and hippocampus (circles). Age is colored by month. (I) Based on the same 1696 CpGs, unsupervised hierarchical clustering was performed using the AD (blue) and B6 (green) mouse cortex (black) and hippocampus (grey).