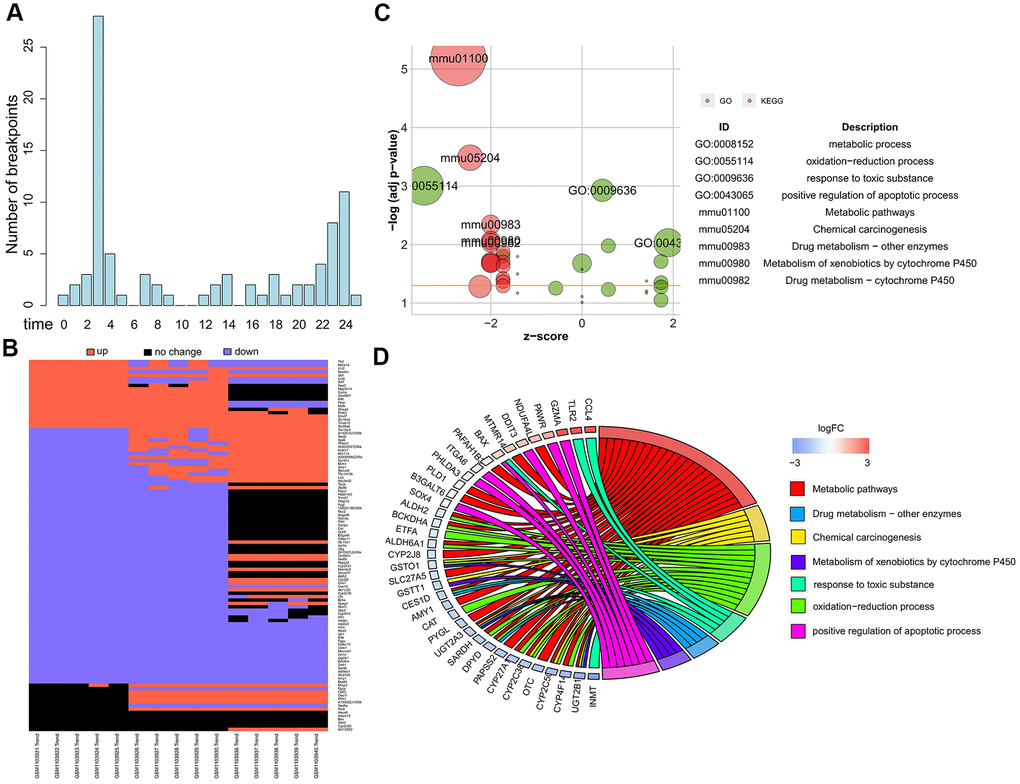
Figure 1.Dynamics of global gene expression after ConA treatment. (A) The breakpoint distribution of 115 top dynamic genes identified by Trendy with R2 > 0.98 is shown. (B) Heatmap shows the expression of top dynamic genes in the liver samples harvested at 0h, 3h, and 24h from 10 mg/Kg ConA treated mice (GSE45413). (C) The most significantly enriched GO terms and KEGG pathways for the top dynamic genes are shown. (D) The GO Chord plot shows the enriched biological function terms for the top dynamic genes. The genes are listed on the left side and their fold change values are shown according to the color scale.