


Introduction
Autoimmune hepatitis (AIH) is a chronic and progressive inflammatory liver disease with a prevalence of 15 cases per 100,000 individuals worldwide [1]. Currently, corticosteroids and azathioprine are used as standard therapy of AIH patients [2]. However, 10-20% of AIH patients are refractory to corticosteroids or azathioprine and progress to cirrhosis and end-stage-liver disease [3]. In the absence of any treatment, nearly 50% of patients with severe AIH die within approximately 5 years [4]. Hence, there is an urgent need to identify genes that correlate with AIH pathogenesis for development of targeted therapy to improve survival outcomes.
Genetic susceptibility, circulating autoantibodies, molecular mimicry, and immune disorders, including dysfunctional T-lymphocyte activation are all related to AIH pathogenesis [5, 6]. However, reliable experimental animal models are required to unravel the mechanistic details underlying AIH and test candidate drugs to alleviate AIH [7, 8]. Concanavalin A (ConA) is a plant lectin that binds to sugar residues of extracellular proteins, thereby agglutinating blood erythrocytes and stimulating immune cells, especially T-lymphocytes [9]. Concanavalin A (ConA)-induced hepatitis model mice mimic AIH characteristics and have been used to evaluate the activity of AIH candidate drugs [10]. However, the genes that regulate ConA-induced liver injury have not been evaluated.
High-throughput genome-wide transcriptome profiling is commonly to identify changes in gene expression and biological pathways under various physiological, pathological or specifically ordered conditions over time or space [11, 12]. Therefore, in this study, we analyzed the liver transcriptome data in the mouse model of ConA-induced hepatitis using Trendy and WGCNA to identify critical genes associated with liver pathology.
Results
Identifying dynamic gene expression changes during concanavalin A-induced acute liver injury using Trendy
We used the Trendy software to analyze global gene expression changes in liver tissues from ConA-induced hepatitis model mice and identify genes with breakpoints/segments (upregulation or downregulation) at 3 h and 24 h after ConA treatment. We identified 115 top dynamic genes with an adjusted R2 >0.98 (Supplementary Table 1). We observed breaks or changes in gene expression at 3 h and 24 h after ConA treatment in all the top dynamic genes compared to their corresponding gene expression at the 0 h time point (Figure 1A). This showed at least two time points or segments at which the top dynamic genes showed differential expression in response to ConA treatment. The differential expression patterns (upregulation or downregulation) of all the top dynamic genes by combining both the time points together are shown in Figure 1B.
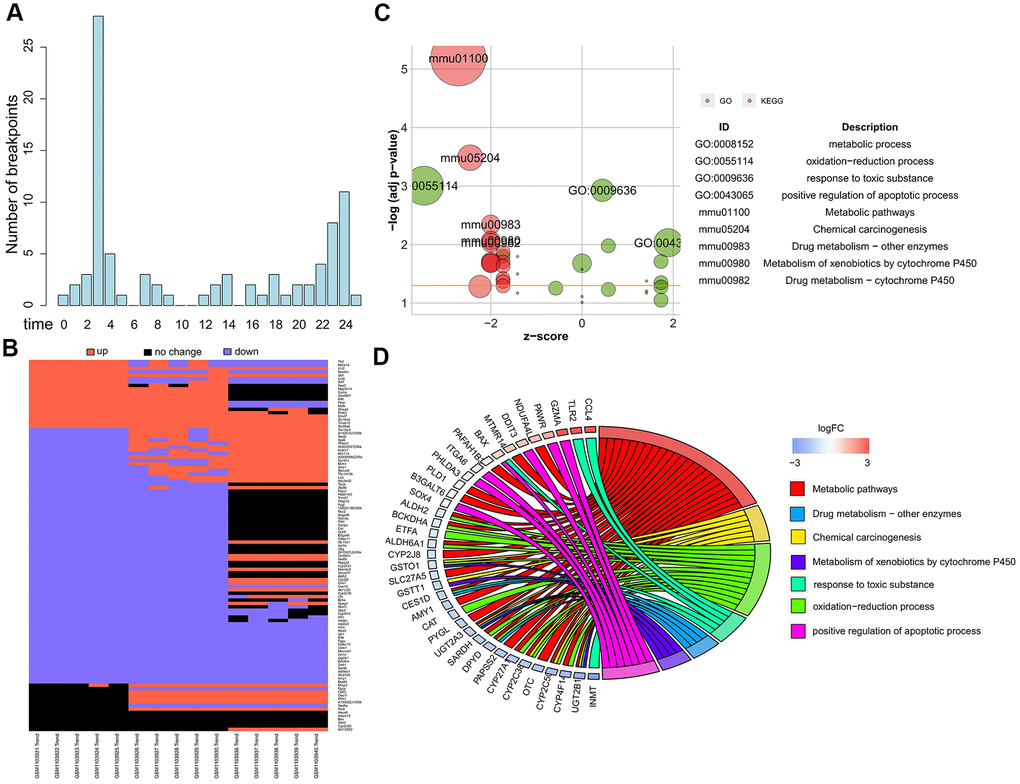
Figure 1. Dynamics of global gene expression after ConA treatment. (A) The breakpoint distribution of 115 top dynamic genes identified by Trendy with R2 > 0.98 is shown. (B) Heatmap shows the expression of top dynamic genes in the liver samples harvested at 0h, 3h, and 24h from 10 mg/Kg ConA treated mice (GSE45413). (C) The most significantly enriched GO terms and KEGG pathways for the top dynamic genes are shown. (D) The GO Chord plot shows the enriched biological function terms for the top dynamic genes. The genes are listed on the left side and their fold change values are shown according to the color scale.
Next, we performed functional enrichment analysis of the top dynamic genes to determine the plausible pathogenetic mechanisms underlying ConA-induced acute liver injury. The most significantly enriched gene ontology (GO) terms related to the top dynamic genes were metabolic process, oxidation-reduction process, response to toxic substances, and positive regulation of apoptotic process (Figure 1C, 1D). The most significantly enriched KEGG pathways were metabolic pathways, chemical carcinogenesis and drug metabolism (Figure 1C). Peng et al. showed that exposure of hepatic cells to toxic substances induced chronic inflammation-related dynamic changes in metabolism [13]. Therefore, we postulate that the top dynamic genes dysregulate metabolic pathways in the ConA-induced hepatitis model mice.
Verification of the top dynamic genes in the ConA-induced hepatitis model mice
We established the ConA hepatitis model mice as shown in Supplementary Figure 1. ConA-treated mice showed significantly enlarged liver, spleen and kidneys and elevated serum ALT and AST levels upon ConA treatment. H&E stained liver sections of ConA-treated mice showed significant infiltration of inflammatory cells, massive hepatocyte necrosis, and disordered hepatic sinusoid structures (Supplementary Figure 1). These findings demonstrated AIH-like characteristics in the ConA hepatitis model mice.
Next, we examined the gene expression of two candidate genes having the extreme breakpoints identified by Trendy, namely, matrix metallopeptidase 3 (Mmp3) and arylacetamide deacetylase (Aadac) in the liver tissues of ConA-induced hepatitis model mice. Trendy analysis showed that the expression of Mmp3 significantly increased at 3 h and peaked at 24 h in the livers of ConA-treated mice (Figure 2A). The mRNA expression of Aadac significantly decreased in the ConA-treated mice livers at 24 h post-ConA treatment (Figure 2A). Both Mmp3 and Aadac play significant roles in the liver functions [14]. Aadac is involved in lipolysis of cellular triacylglycerol stores and the assembly of very low-density lipoprotein (VLDL) [15]. The top 5 dynamic genes (Cd63, Saa3, Slc10a1, Nrxn1, Ugt2a3) differentially expressed in the ConA-treated mice livers were verified by qRT-PCR analysis (Figure 2B). These results confirm that significant changes in the expression of the top dynamic genes correlate with acute hepatitis in the ConA-induced hepatitis model mice.
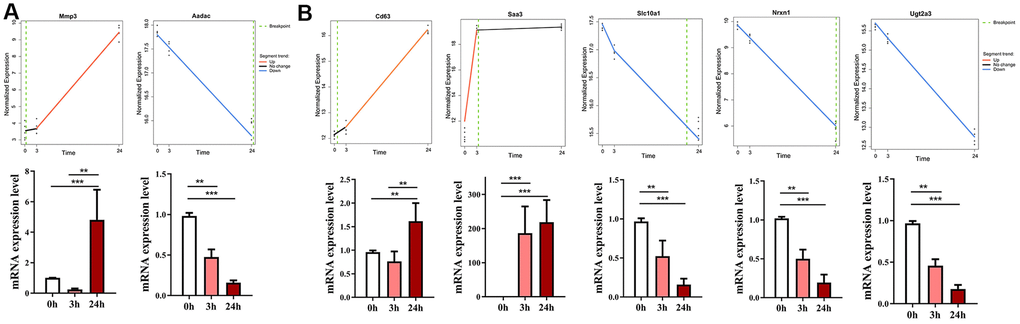
Figure 2. Validation of gene expression of top dynamic genes in the ConA hepatitis model mice. (A) The expression of two genes with the earliest or latest breakpoint time (Mmp3 at 3 h, and Aadac at 24 h) as determined by Trendy (upper panel) were verified by qRT-PCR analysis (bottom panel) of the liver tissues from the in vivo ConA-treated hepatitis model mice. (B) qRT-PCR results show the mRNA levels of the top 5 dynamic genes (Cd63, Saa3, Slc10a1, Nrxn1, Ugt2a3) in the liver tissues of the ConA-liver injury model mice at 0h, 3h, and 24 h respectively. All data are shown as means ± SEM (n = 5 per group). * p < 0.05; ** p < 0.01; *** p < 0.001.
WCGNA identifies two top modules with hub genes that overlap with top dynamic genes identified by Trendy
Weighted gene co-expression network analysis (WGCNA) was widely utilized to identify the hub genes of diseases. To determine if the top dynamic genes identified by Trendy could also be reproduced by the hub gene analysis, we first constructed gene coexpression networks of ConA-induced liver injury using global transcriptome. We identified the brown module with 910 genes and the turquoise module with 2992 genes as the top 2 modules (Figure 3A).
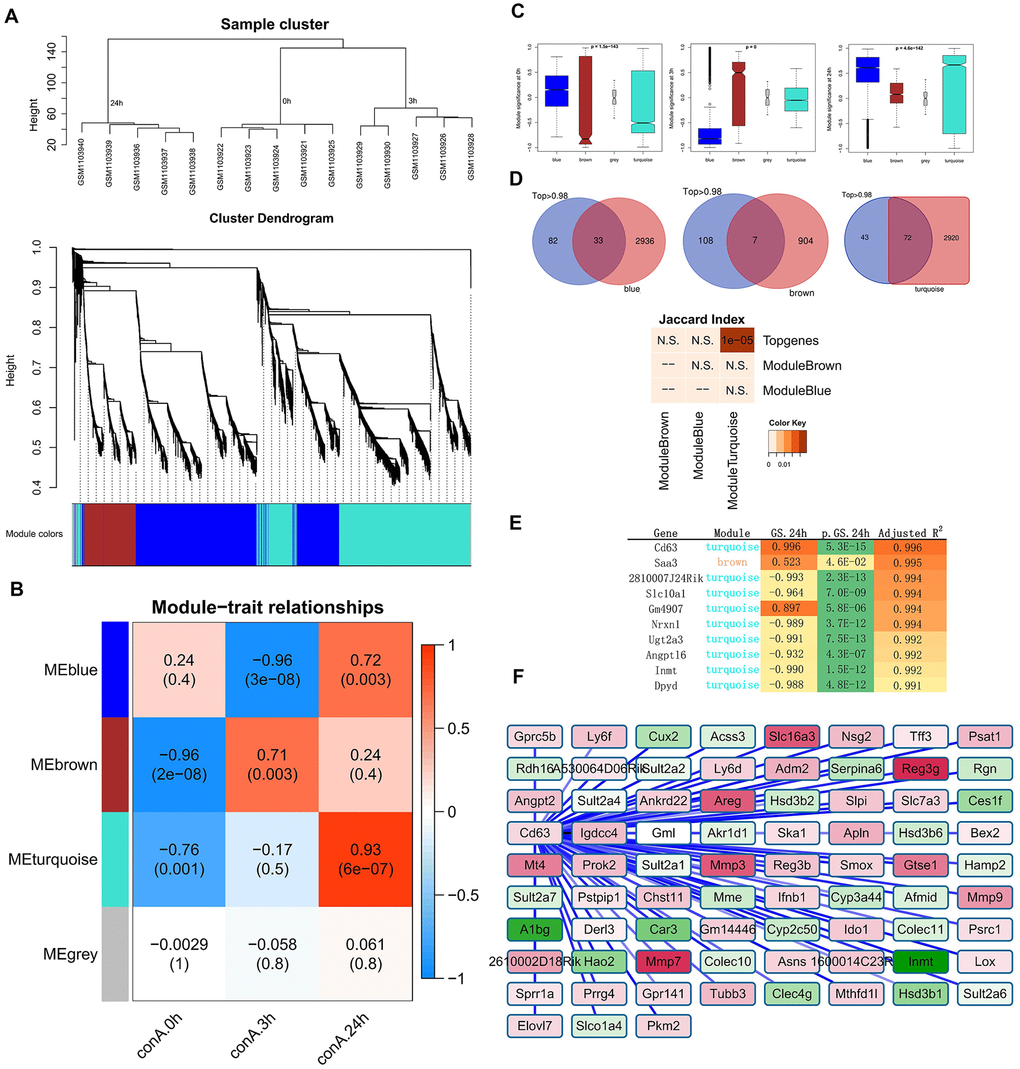
Figure 3. Identification of top gene modules and hub genes related to liver injury in ConA-treated mice by WGCNA. (A) The cluster dendrogram of 6936 genes in the ConA-treated murine liver samples is shown. The colored bars at the bottom show the color that are designated for specific gene clusters (3 modules). (B) Heatmap shows the correlation between module eigengenes (ME) and the trait (time of liver injury). Each row corresponds to a single module eigengene and the corresponding column represents a trait. Each cell contains the corresponding correlation and p value. (C) Module significance (MS) of each module based on the average absolute gene significance values of all genes in a module are shown for the 3 h and 24 h time points. (D) Venn diagram shows the overlap between the top genes identified by Trendy and the module genes detected by WGCNA. The lower panel shows the significant overlap between the top dynamic genes and the module genes in the turquoise module. (E) Top 10 hub genes in the turquoise module and their gene significance values. (F) Gene co-expression network shows the relationship between Cd63 and its co-expressed genes. The node colors are denoted from green to red (low to high) based on the fold change of gene expression between 3-24 h after ConA administration relative to their expression at 0h.
At 3 h after ConA treatment, the brown module showed the highest module significance (MS) value; the turquoise module showed the highest MS value at 24 h after ConA treatment (Figure 3B–3C). Functional enrichment analyses showed that the brown module was significantly enriched in inflammatory response and cytokine-cytokine receptor interaction pathways, whereas, the turquoise module was significantly enriched in the oxidation-reduction process and chemical carcinogenesis pathway (Supplementary Table 2).
We identified the hub genes in the turquoise module using the network feature selection of WGCNA (Figure 3D). The genes in the turquoise module were ranked according to their gene significance (GS) values. Most of the hub genes in the turquoise module overlapped with the top dynamic genes identified by Trendy (Figure 3E). The highest ranked hub gene in the turquoise module was Cluster determinant 63 (Cd63, GS = 0.996). Cd63 is an exosomal marker in the drug-resistant HCC-derived exosomes [16]. Cd63 and Cd63-related genes were enriched in pathways related to chemical carcinogenesis and metabolic pathways (Figure 3F).
Cd63 silencing ameliorates ConA-induced hepatic injury in mice
We then investigated the effects of silencing Cd63 in the ConA-induced hepatitis model mice. The mice injected with lentiviruses carrying Cd63-specific shRNAs showed 50% reduction in the Cd63 mRNA levels in the liver tissues compared to the corresponding controls (Figure 4A). The survival rates of the Cd63-silenced ConA-induced mice were significantly higher than the corresponding control group mice (Figure 4B). We also analyzed serum ALT and AST levels in the control and Cd63-silenced groups of mice at 8 h after ConA injection. The serum ALT and AST levels, which were estimated at 8 h after ConA injection, were significantly lower in the Cd63-silenced group mice compared to the control group mice (Figure 4C).
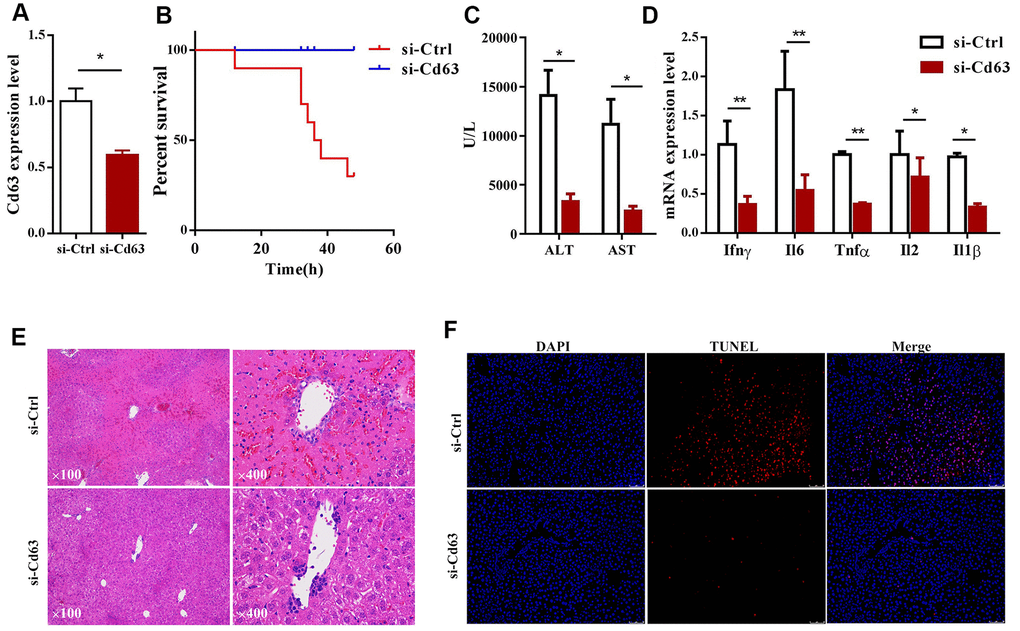
Figure 4. Cd63 silencing protects against in vivo ConA-induced liver injury. (A) qRT-PCR analysis shows Cd63 mRNA expression in the liver tissues of control (sh-Ctrl) and Cd63 knockdown (sh-Cd63) group mice. (B) Survival curves show overall survival rates of sh-Ctrl and sh-Cd63 group mice after 15mg/Kg ConA treatment. (C) Comparison of serum ALT and AST levels in the sh-Ctrl and sh-Cd63 group mice treated with ConA. (D) qRT-PCR analysis shows the relative mRNA levels of pro-inflammatory genes, IL-1β, IFN-γ, IL-2, IL-6, and TNF-α in the liver tissues of sh-Ctrl and sh-Cd63 group mice. All data are shown as means ± SEM (n = 5 per group). * p < 0.05; ** p < 0.01; *** p < 0.001. (E) Representative images show H&E stained liver sections of sh-Ctrl and sh-Cd63 group mice. (F) Representative images show TUNEL stained liver sections of sh-Ctrl and sh-Cd63 mice.
H&E stained liver sections estimated at 24h showed widespread tissue necrosis in ConA-treated control group mice, but necrosis was significantly reduced in the Cd63-silenced group mice treated with ConA (Figure 4E). TUNEL assay results showed that hepatocyte death was significantly reduced in the Cd63-silenced group mice treated with ConA compared to the ConA-treated control group mice (Figure 4F). qRT-PCR analysis showed that the mRNA levels of pro-inflammatory mediators such as IL-1β, IFN-γ, IL-2, IL-6, TNF-α were significantly lower in the liver tissues from the Cd63-silenced group mice compared to the liver tissues from the ConA-treated control group mice (Figure 4D). Overall, our results suggest that Cd63 deletion significantly reduces liver injury in the ConA-treated mice.
Discussion
AIH is a complex polygenic disorder that requires development of new effective therapeutic strategies including targeted therapies to reduce morbidity and mortality. Though evidence has showed that several genes including multiple major histocompatibility complex (MHC)-related genes, AIRE (autoimmunity regulator) and CYP2D6 (hepatocyte enzyme) are associated with AIH risk [17], but the mechanistic details regarding the development and pathogenesis of AIH are complex and remain to be fully elucidated.
We analyzed dynamic changes in the ConA-induced hepatitis mouse model at individual gene and whole transcriptome levels to identify key genes involved in AIH pathogenesis. We used Trendy software to identify top dynamic genes based on the time-course gene expression data of liver tissue samples from the ConA-hepatitis model mice. We then identified several key gene modules and hub genes using WGCNA. Majority of the hub genes in the turquoise module were the top dynamic genes identified by Trendy. Cd63 was the top hub gene in the turquoise module. The in vivo ConA hepatitis mouse model showed AIH-like pathology. Cd63 silencing significantly reduced liver pathology and increased survival outcomes in the ConA-treated mice. The role of Cd63 has not been documented in liver injury. However, several studies show that Cd63 plays a crucial role in tumor cell plasticity and metastasis [18]. Tissue inhibitor of metalloproteinases-1 (Timp1) signaling via Cd63 activates hepatic stellate cells and creates a favorable environment in the liver for the pancreatic tumor cells [19]. We demonstrate that ConA treatment increases Timp1 expression at all time points analyzed (Supplementary Figure 2). We also demonstrate that Cd63 knockdown reduces serum AST and ALT levels as well as pathological lesions in the liver tissues of ConA-treated mice. Previous studies demonstrate that ConA treatment activates immune cells and mediates chronic inflammation resulting in the secretion of several pro-inflammatory mediators that aggravate liver injury [20]. We demonstrate that ablation of Cd63 significantly reduces the production of pro-inflammatory mediators and necrosis in the liver tissues.
Our study identified several top dynamic genes that might play a significant role in AIH pathology. Future investigations are necessary to unravel the functions of these genes in AIH. For instance, Saa3 is an inducible form of serum amyloid A (SAA) that is highly expressed in the adipose tissues under acute inflammatory stimuli and obesity, and it promotes monocyte chemotaxis and macrophage accumulation in the adipose tissues [21]. Moreover, Saa3 is required for normal weight and metabolic functions of the immune system in mice [22]. Sult2a8 (2810007J24Rik) catalyzes the 7α-hydroxyl sulfation of the bile acids [23], and acts as a novel PPARα-dependent gene [24]. Slc10a1 (Ntcp) functions as a bile acid transporter and prevents bile acid toxicity after partial hepatectomy in mice [25]. Further investigations are necessary to determine if the top dynamic genes are therapeutic targets for AIH.
In summary, our study identifies several candidate genes that are differentially regulated during ConA-mediated hepatitis using Trendy and WGCNA. Furthermore, we demonstrate that ablation of Cd63 reduces ConA-induced liver pathology and improves survival rates in the ConA hepatitis model mice.
Materials and Methods
Transcriptome data analysis
The time-course transcriptome profile of the ConA hepatitis murine model was retrieved from the GSE45413 dataset in the GEO database [26]. This dataset was generated with liver tissues collected at 0 h, 3 h, and 24 h after 10mg/kg ConA injection into 8-12 week old C57BL/6 male mice. The microarray data was normalized by selecting probes for genes with a mean expression in the top 75% and removing the lowly-expressing genes. Then, we selected the genes with above average expression variance. We then collapsed different probes that targeted the same gene, resulting in 6936 genes [27]. Finally, we identified differentially expressed genes using the limma R package.
Identification of top dynamic genes using Trendy
We used the Trendy R package to characterize dynamic gene-specific expression patterns over a time-course during acute liver injury [28]. In brief, Trendy fits a set of segmented regression models with varying numbers of breakpoints for each gene. Each breakpoint represents a dynamic change of gene expression over time. Genes with high R2 values were categorized as top dynamic genes. Then, the parameter estimates of the optimal model including the sign and p-value of the slope estimate were used to determine the direction (up, down, or no-change) of the changes in the expression of the top dynamic genes over time.
Weighted gene co-expression network analysis
The top dynamic genes were evaluated by weighted gene co-expression network analysis (WGCNA) to identify gene modules and hub genes [29]. In brief, the eigengene module was identified based on the weighted average of the gene expression profiles by evaluating the matrix of pair-wise Pearson's correlation coefficients. Then, the gene significance (GS) was computed for each gene within the eigengene module at all time points after ConA injection (3 h and 24 h). The geometric mean was then calculated for the absolute values of all the GS values within each module to determine the module significance (MS) of each module. Modules with higher MS values significantly correlated with the trait (time of liver injury). The network of the module genes was visualized using Cytoscape.
Functional enrichment analysis
We used the DAVID database (https://david-d.ncifcrf.gov/) [30], and GOplot [31] to determine significant gene ontology (GO) terms and Kyoto Encyclopedia of Gene and Genomes (KEGG) pathways related to the module genes.
Establishment of Cd63 knockdown mice
We obtained 8-12 week old C57BL/6 male mice weighing 20-25g from the Shanghai Slac Laboratory Animal Co. Ltd (Shanghai, China). The mice were housed in a specific-pathogen-free facility with a consistent room temperature and humidity. We generated lentiviruses carrying shRNA-Cd63 (CCAGGTGAAGTCAGAGTTTAA) or control scrambled shRNA (shRNA-Ctrl) vector as previously described [32]. Four weeks before the ConA injection, lentiviruses carrying the sh-Cd63 or sh-Control (sh-Ctrl) was injected into the tail vein of mice (n=5/group).
ConA-induced hepatitis model mice
We injected mice with 10 mg/kg ConA (prepared in saline) through the lateral tail vein. For the survival assay, 15 mg/kg ConA was used. At the indicated time points (0 h, 3 h, and 24 h), blood samples were obtained through retro-orbital bleeds and serum samples were prepared and stored at -80° C until measured by automatic biochemical analyzer (Hitachi Auto Analyzer 7170, Japan) for aspartate aminotransferase (AST) and alanine aminotransferase (ALT). Then, the mice were sacrificed and liver samples were harvested and stored for further experiments.
Quantitative real time PCR
Total RNA was extracted from the murine liver tissues using Trizol (Invitrogen). Equal amounts of RNA were reverse-transcribed into cDNA using the PrimeScript RT reagent kit (Takara Bio). Then, gene expression was analyzed by qPCR with the SYBR Premix Ex Taq kit (Takara Bio) in the ABI 7900 Real-Time PCR System. The expression of various genes relative to GAPDH (housekeeping gene) was determined using the 2-ΔΔCt method.
Histopathology assays
The murine liver tissue samples were fixed in 4% paraformaldehyde for 48 h and then paraffin embedded. Then, 4-5 μm thick paraffin embedded liver sections were cut, deparaffinized with xylene, rehydrated with decreasing concentrations of ethanol, and stained with hematoxylin and eosin (H&E). Cryosections of liver tissues were fixed with 4% paraformaldehyde in PBS for 15 min. Then, relative levels of apoptosis were quantified in all samples using the TUNEL assay with the In Situ Cell Death Detection Kit (Roche) according to the manufacturer's instructions.
Statistical analysis
The data are expressed as means ± SEM. The statistical differences between samples were compared using 2-tailed Student’s t tests. p<0.05 was considered statistically significant.
Ethical standards
The experiments were carried out according to the protocols approved by the Ethical Committee of the Affiliated Hospital of Hangzhou Normal University (Approval No. 2019(02)-HS-51).
Author Contributions
JY, ZC, and JS: project conceptualization, design, and supervision; JW, DT, QZ and YL: data collection, processing, and methodology; AC, WY, JW and AL: perform experiments; AC, ZC, JS and JY: manuscript writing and review. All authors approved the final version of the manuscript.
Conflicts of Interest
The authors declare that there are no conflicts of interest.
Funding
This work was supported by the National Natural Science Foundation of China (Grant number: 81772520), Zhejiang Provincial Natural Science Foundation (Grant number: LGF19H030004), and Zhejiang medical and health technology project (Grant number: 2018PY039).
References
- 1. de Boer YS, van Gerven NM, Zwiers A, Verwer BJ, van Hoek B, van Erpecum KJ, Beuers U, van Buuren HR, Drenth JP, den Ouden JW, Verdonk RC, Koek GH, Brouwer JT, and Dutch Autoimmune Hepatitis Study Group, and LifeLines Cohort Study, and Study of Health in Pomerania. Genome-wide association study identifies variants associated with autoimmune hepatitis type 1. Gastroenterology. 2014; 147:443–52.e5. https://doi.org/10.1053/j.gastro.2014.04.022 [PubMed]
- 2. Taubert R, Hupa-Breier KL, Jaeckel E, Manns MP. Novel therapeutic targets in autoimmune hepatitis. J Autoimmun. 2018; 95:34–46. https://doi.org/10.1016/j.jaut.2018.10.022 [PubMed]
- 3. Lammert C, Loy VM, Oshima K, Gawrieh S. Management of difficult cases of autoimmune hepatitis. Curr Gastroenterol Rep. 2016; 18:9. https://doi.org/10.1007/s11894-015-0484-7 [PubMed]
- 4. Ye T, Wang T, Yang X, Fan X, Wen M, Shen Y, Xi X, Men R, Yang L. Comparison of concanavalin a-induced murine autoimmune hepatitis models. Cell Physiol Biochem. 2018; 46:1241–51. https://doi.org/10.1159/000489074 [PubMed]
- 5. Doycheva I, Watt KD, Gulamhusein AF. Autoimmune hepatitis: current and future therapeutic options. Liver Int. 2019; 39:1002–13. https://doi.org/10.1111/liv.14062 [PubMed]
- 6. Floreani A, Restrepo-Jiménez P, Secchi MF, De Martin S, Leung PS, Krawitt E, Bowlus CL, Gershwin ME, Anaya JM. Etiopathogenesis of autoimmune hepatitis. J Autoimmun. 2018; 95:133–43. https://doi.org/10.1016/j.jaut.2018.10.020 [PubMed]
- 7. Christen U. Animal models of autoimmune hepatitis. Biochim Biophys Acta Mol Basis Dis. 2019; 1865:970–81. https://doi.org/10.1016/j.bbadis.2018.05.017 [PubMed]
- 8. Christen U, Hintermann E. Immunopathogenic mechanisms of autoimmune hepatitis: how much do we know from animal models? Int J Mol Sci. 2016; 17:2007. https://doi.org/10.3390/ijms17122007 [PubMed]
- 9. Heymann F, Hamesch K, Weiskirchen R, Tacke F. The concanavalin a model of acute hepatitis in mice. Lab Anim. 2015; 49:12–20. https://doi.org/10.1177/0023677215572841 [PubMed]
- 10. Bonito AJ, Aloman C, Fiel MI, Danzl NM, Cha S, Weinstein EG, Jeong S, Choi Y, Walsh MC, Alexandropoulos K. Medullary thymic epithelial cell depletion leads to autoimmune hepatitis. J Clin Invest. 2013; 123:3510–24. https://doi.org/10.1172/JCI65414 [PubMed]
- 11. Spies D, Ciaudo C. Dynamics in transcriptomics: advancements in RNA-seq time course and downstream analysis. Comput Struct Biotechnol J. 2015; 13:469–77. https://doi.org/10.1016/j.csbj.2015.08.004 [PubMed]
- 12. Sun X, Dalpiaz D, Wu D, S Liu J, Zhong W, Ma P. Statistical inference for time course RNA-seq data using a negative binomial mixed-effect model. BMC Bioinformatics. 2016; 17:324. https://doi.org/10.1186/s12859-016-1180-9 [PubMed]
- 13. Peng B, Liu F, Han R, Luo G, Cathopoulis T, Lu K, Li X, Yang L, Liu GY, Cai JC, Shi SL. Dynamic metabolic change is indicative of inflammation-induced transformation of hepatic cells. Int J Biochem Cell Biol. 2015; 66:45–58. https://doi.org/10.1016/j.biocel.2015.07.007 [PubMed]
- 14. Luna-Vital D, Luzardo-Ocampo I, Cuellar-Nuñez ML, Loarca-Piña G, Gonzalez de Mejia E. Maize extract rich in ferulic acid and anthocyanins prevents high-fat-induced obesity in mice by modulating SIRT1, AMPK and IL-6 associated metabolic and inflammatory pathways. J Nutr Biochem. 2020; 79:108343. https://doi.org/10.1016/j.jnutbio.2020.108343 [PubMed]
- 15. Nourbakhsh M, Douglas DN, Pu CH, Lewis JT, Kawahara T, Lisboa LF, Wei E, Asthana S, Quiroga AD, Law LM, Chen C, Addison WR, Nelson R, et al. Arylacetamide deacetylase: a novel host factor with important roles in the lipolysis of cellular triacylglycerol stores, VLDL assembly and HCV production. J Hepatol. 2013; 59:336–43. https://doi.org/10.1016/j.jhep.2013.03.022 [PubMed]
- 16. Qu Z, Wu J, Wu J, Luo D, Jiang C, Ding Y. Exosomes derived from HCC cells induce sorafenib resistance in hepatocellular carcinoma both in vivo and in vitro. J Exp Clin Cancer Res. 2016; 35:159. https://doi.org/10.1186/s13046-016-0430-z [PubMed]
- 17. Oo YH, Hubscher SG, Adams DH. Autoimmune hepatitis: new paradigms in the pathogenesis, diagnosis, and management. Hepatol Int. 2010; 4:475–93. https://doi.org/10.1007/s12072-010-9183-5 [PubMed]
- 18. Seubert B, Cui H, Simonavicius N, Honert K, Schäfer S, Reuning U, Heikenwalder M, Mari B, Krüger A. Tetraspanin CD63 acts as a pro-metastatic factor via β-catenin stabilization. Int J Cancer. 2015; 136:2304–15. https://doi.org/10.1002/ijc.29296 [PubMed]
- 19. Grünwald B, Harant V, Schaten S, Frühschütz M, Spallek R, Höchst B, Stutzer K, Berchtold S, Erkan M, Prokopchuk O, Martignoni M, Esposito I, Heikenwalder M, et al. Pancreatic premalignant lesions secrete tissue inhibitor of metalloproteinases-1, which activates hepatic stellate cells via CD63 signaling to create a premetastatic niche in the liver. Gastroenterology. 2016; 151:1011–24.e7. https://doi.org/10.1053/j.gastro.2016.07.043 [PubMed]
- 20. Mieli-Vergani G, Vergani D, Czaja AJ, Manns MP, Krawitt EL, Vierling JM, Lohse AW, Montano-Loza AJ. Autoimmune hepatitis. Nat Rev Dis Primers. 2018; 4:18017. https://doi.org/10.1038/nrdp.2018.17 [PubMed]
- 21. den Hartigh LJ, Wang S, Goodspeed L, Ding Y, Averill M, Subramanian S, Wietecha T, O’Brien KD, Chait A. Deletion of serum amyloid A3 improves high fat high sucrose diet-induced adipose tissue inflammation and hyperlipidemia in female mice. PLoS One. 2014; 9:e108564. https://doi.org/10.1371/journal.pone.0108564 [PubMed]
- 22. Ather JL, Poynter ME. Serum amyloid A3 is required for normal weight and immunometabolic function in mice. PLoS One. 2018; 13:e0192352. https://doi.org/10.1371/journal.pone.0192352 [PubMed]
- 23. Shimohira T, Kurogi K, Liu MC, Suiko M, Sakakibara Y. The critical role of His48 in mouse cytosolic sulfotransferase SULT2A8 for the 7α-hydroxyl sulfation of bile acids. Biosci Biotechnol Biochem. 2018; 82:1359–65. https://doi.org/10.1080/09168451.2018.1464897 [PubMed]
- 24. Feng L, Yuen YL, Xu J, Liu X, Chan MY, Wang K, Fong WP, Cheung WT, Lee SS. Identification and characterization of a novel PPARα-regulated and 7α-hydroxyl bile acid-preferring cytosolic sulfotransferase mL-STL (Sult2a8). J Lipid Res. 2017; 58:1114–31. https://doi.org/10.1194/jlr.M074302 [PubMed]
- 25. Csanaky IL, Aleksunes LM, Tanaka Y, Klaassen CD. Role of hepatic transporters in prevention of bile acid toxicity after partial hepatectomy in mice. Am J Physiol Gastrointest Liver Physiol. 2009; 297:G419–33. https://doi.org/10.1152/ajpgi.90728.2008 [PubMed]
- 26. Fujita T, Soontrapa K, Ito Y, Iwaisako K, Moniaga CS, Asagiri M, Majima M, Narumiya S. Hepatic stellate cells relay inflammation signaling from sinusoids to parenchyma in mouse models of immune-mediated hepatitis. Hepatology. 2016; 63:1325–39. https://doi.org/10.1002/hep.28112 [PubMed]
- 27. Lou Y, Tian GY, Song Y, Liu YL, Chen YD, Shi JP, Yang J. Characterization of transcriptional modules related to fibrosing-NAFLD progression. Sci Rep. 2017; 7:4748. https://doi.org/10.1038/s41598-017-05044-2 [PubMed]
- 28. Bacher R, Leng N, Chu LF, Ni Z, Thomson JA, Kendziorski C, Stewart R. Trendy: segmented regression analysis of expression dynamics in high-throughput ordered profiling experiments. BMC Bioinformatics. 2018; 19:380. https://doi.org/10.1186/s12859-018-2405-x [PubMed]
- 29. Langfelder P, Horvath S. WGCNA: an R package for weighted correlation network analysis. BMC Bioinformatics. 2008; 9:559. https://doi.org/10.1186/1471-2105-9-559 [PubMed]
- 30. Huang da W, Sherman BT, Lempicki RA. Systematic and integrative analysis of large gene lists using DAVID bioinformatics resources. Nat Protoc. 2009; 4:44–57. https://doi.org/10.1038/nprot.2008.211 [PubMed]
- 31. Walter W, Sánchez-Cabo F, Ricote M. GOplot: an R package for visually combining expression data with functional analysis. Bioinformatics. 2015; 31:2912–14. https://doi.org/10.1093/bioinformatics/btv300 [PubMed]
- 32. Li Z, Lou Y, Tian G, Wu J, Lu A, Chen J, Xu B, Shi J, Yang J. Discovering master regulators in hepatocellular carcinoma: one novel MR, SEC14L2 inhibits cancer cells. Aging (Albany NY). 2019; 11:12375–411. https://doi.org/10.18632/aging.102579 [PubMed]