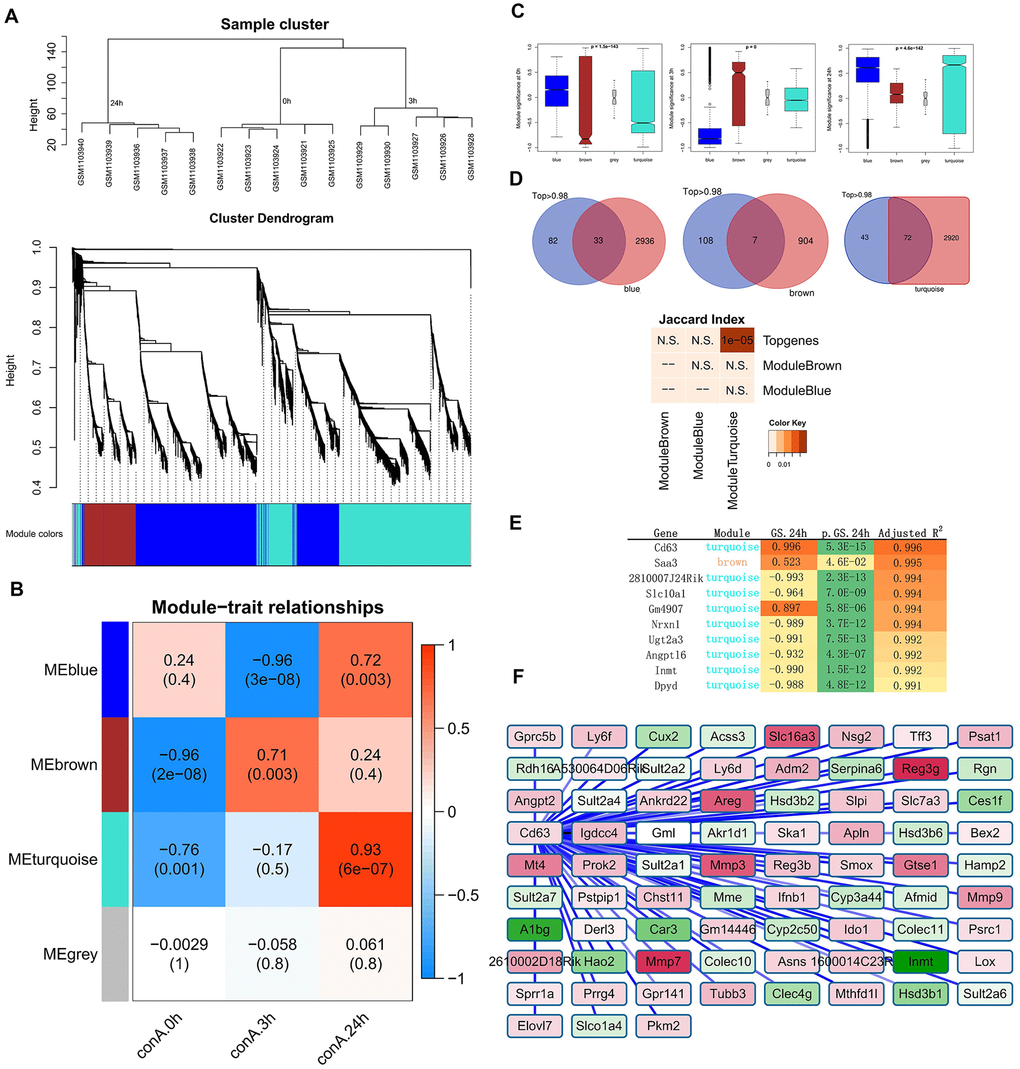
Figure 3.Identification of top gene modules and hub genes related to liver injury in ConA-treated mice by WGCNA. (A) The cluster dendrogram of 6936 genes in the ConA-treated murine liver samples is shown. The colored bars at the bottom show the color that are designated for specific gene clusters (3 modules). (B) Heatmap shows the correlation between module eigengenes (ME) and the trait (time of liver injury). Each row corresponds to a single module eigengene and the corresponding column represents a trait. Each cell contains the corresponding correlation and p value. (C) Module significance (MS) of each module based on the average absolute gene significance values of all genes in a module are shown for the 3 h and 24 h time points. (D) Venn diagram shows the overlap between the top genes identified by Trendy and the module genes detected by WGCNA. The lower panel shows the significant overlap between the top dynamic genes and the module genes in the turquoise module. (E) Top 10 hub genes in the turquoise module and their gene significance values. (F) Gene co-expression network shows the relationship between Cd63 and its co-expressed genes. The node colors are denoted from green to red (low to high) based on the fold change of gene expression between 3-24 h after ConA administration relative to their expression at 0h.