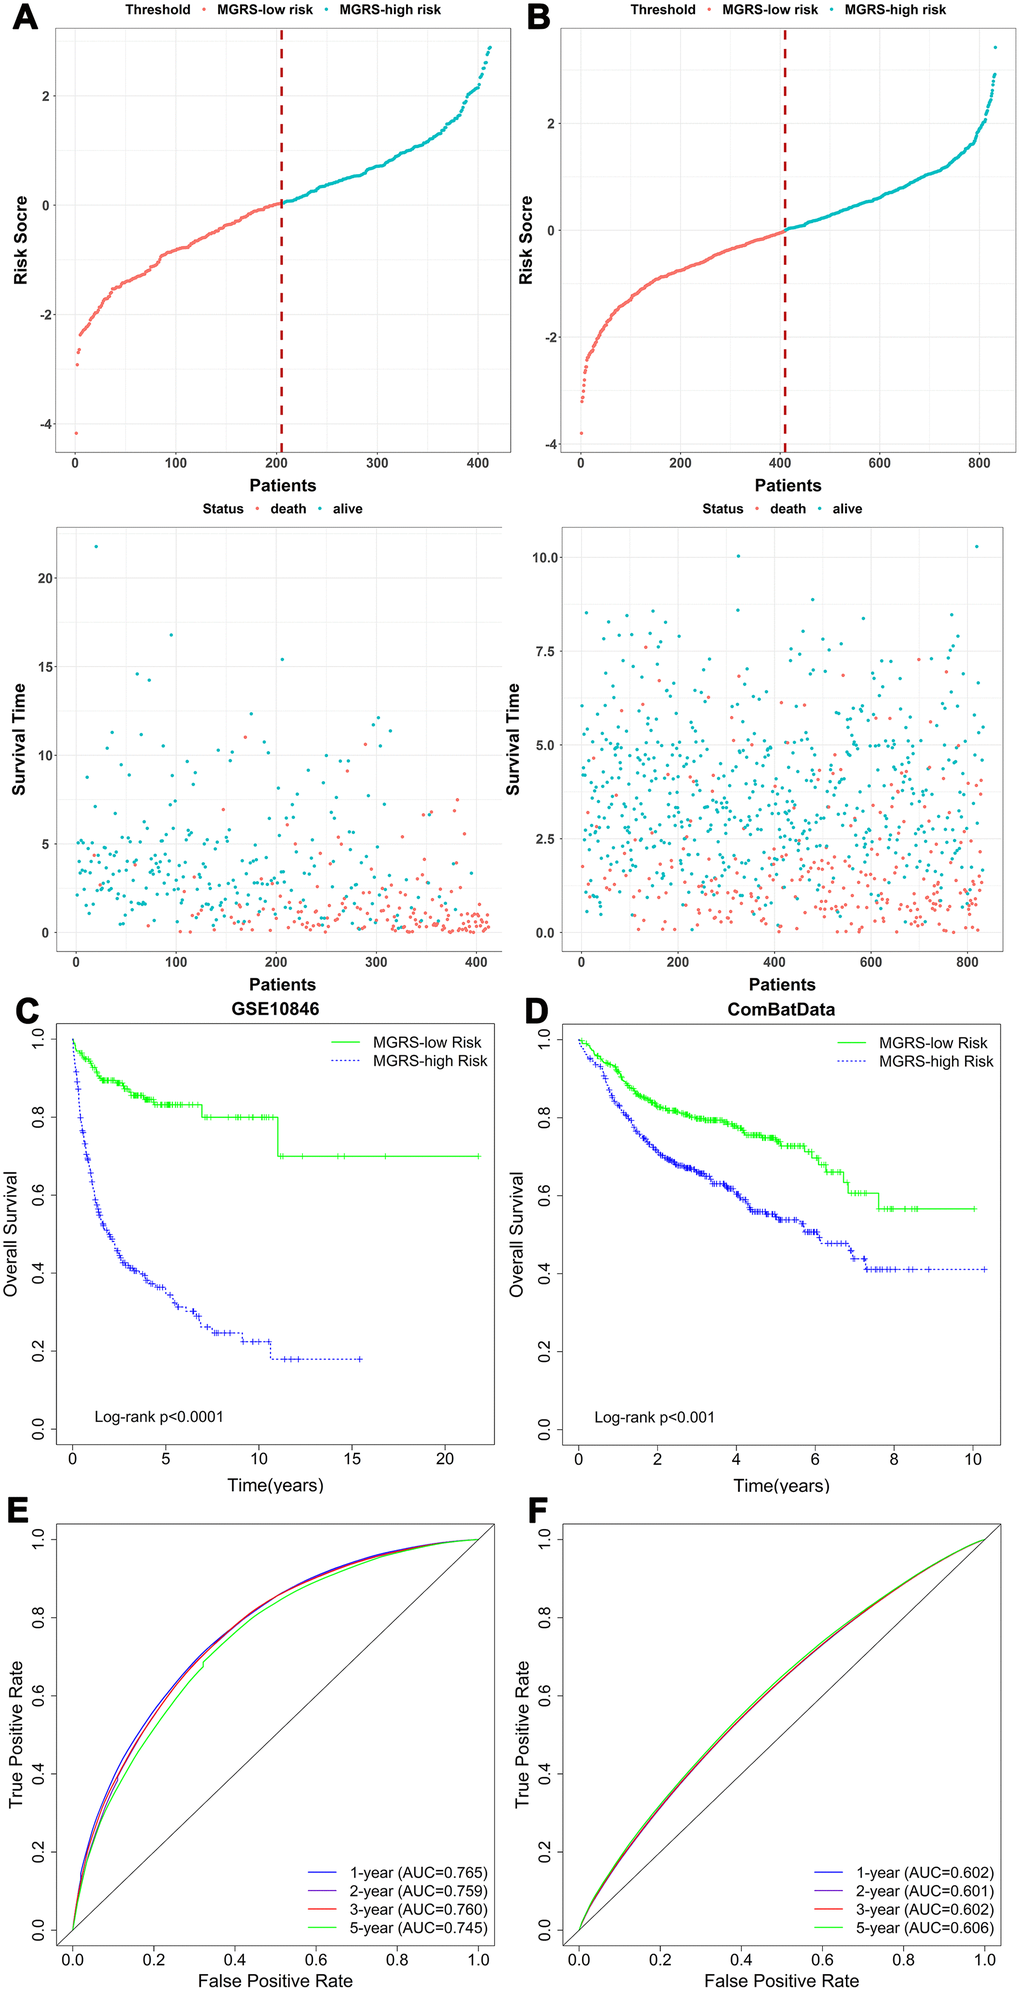
Figure 3.The relationship between multigene risk score (MGRS) and overall survival of patients with DLBCL. Distribution of MGRS and survival status in (A) the training dataset and (B) the validation dataset; (C, D) Kaplan–Meier survival curves of MGRS-high risk and MGRS-low risk groups in the training and validation datasets; (E, F) Time-dependent ROC curves at 1, 2, 3, and 5 years after diagnosis for the MGRS in the training and validation datasets.