


Introduction
Diffuse large B-cell lymphoma (DLBCL) is a major subtype of non-Hodgkin’s lymphoma characterized by remarkable clinical and biological heterogeneity [1]. Although most patients are cured with upfront chemoimmunotherapy, approximately 40% of patients have an adverse prognosis [2]. If high-risk patients can be identified prospectively, they could receive more effective therapy. Recent studies have highlighted that the occurrence of adverse events (relapse, progression, death, etc.) within 24 months from diagnosis is decisive for the survival outcome of patients with DLBCL [3–6]. Maturer et al. [6] and Jakobsen et al. [5] showed that patients who achieved event-free survival at 24 months and Maturer et al. [4] showed that patients who achieved progression-free survival at 24 months had similar overall survival to DLBCL-free individuals in the general population. Ekberg et al. [3] found that the remaining life expectancy of patients who survived the first 24 months after diagnosis was close to that of the general population. Together, these findings implied that most of the high-risk patients with DLBCL experienced an adverse event in the first 24 months after diagnosis. Therefore, accurate prediction of early events is critical in detecting high-risk patients with DLBCL.
Clinical prognostic scores, including the International Prognostic Index (IPI), age-adjusted IPI, revised IPI, and National Comprehensive Cancer Network IPI [7], have been used to estimate the survival chance of patients with DLBCL beyond a certain time point. In 2018, treatment decisions still relied mainly on clinical factors outlined in the IPI [8]. However, these clinical prognostic models fail to reliably predict the clinical course of lymphoma and patients with identical prognostic scores often have variable outcomes [2]. This finding highlights the need for more precise, patient-specific, and biologically-based biomarkers to predict outcomes of DLBCL. Specific genetic alterations and abnormal protein abundance were found to partially explain the diverse outcome of DLBCL [9, 10]. For example, DLBCLs with MYC rearrangements and BCL2 and/or BCL6 translocations (double/triple hit) have a poor prognosis [9, 11, 12]. The combination of MYC rearrangements and inactive TP53 mutations adversely affected the patients’ overall survival [8, 12, 13]. DLBCLs with overabundance of both the MYC and BCL2 proteins also have been associated with poor prognosis [8, 12]. Abnormal gene expression is considered as another factor that can be used independently of the IPI to predict the outcome of DLBCLs [14–17]. Several mRNA-based molecular signatures have been developed for DLBCL prognostic stratification [15, 17, 18]. However, Hong et al. [19] evaluated the performance of some of these signatures and found that they provide limited added value in risk assessment of DLBCLs. These findings implied that other undiscovered RNA signatures may help to explain the heterogeneity of outcomes in patients with DLBCL.
Long non-coding RNAs (lncRNAs) are >200-nt long RNAs that are involved in multiple biological processes, including cell differentiation and development [20–22]. Mutations and misregulation of lncRNAs have been found to promote tumorigenesis and metastasis in various types of cancer [23], and thousands of lncRNAs have been reported to be abnormally expressed in DLBCLs compared with their expression in normal B-cells [24]. Cheng et al. [25] demonstrated that upregulation of lncRNA TUG1 had an oncogenic role in DLBCL by inhibiting the ubiquitination of MET. LncRNA MALAT1 was found to promote tumorigenesis and immune escape of DLBCLs by sponging the microRNA miR-195 [26], and high expression levels of lncRNA NEAT1_1 were shown to be associated with poor prognosis of DLBCL [27]. These findings indicated that lncRNAs may be promising novel biomarkers for DLBCL diagnosis and prognosis.
Gene signatures that integrate mRNAs and lncRNAs have been suggested to have good prognostic value in breast and colon cancers [28, 29]. We considered that combinations of mRNAs and lncRNAs may improve risk prediction for patients with DLBCL. Therefore, the purpose of this study was to develop and validate an integrated mRNA–lncRNA signature that could refine the IPI model for early event/long-term survival prediction.
Results
Characteristics of the datasets used in this study
A total of 1244 patients from five Gene Expression Omnibus (GEO) datasets (https://www.ncbi.nlm.nih.gov/geo/) were selected and comprehensively studied. The characteristics of the training dataset and the validation dataset and its components are summarized in Supplementary Table 1. We used GSE10846, which included 412 patients with DLBCL, as the training dataset; 163 of them had died (event) and 122 of them (122/163) died within the first 2 years after diagnosis. The validation dataset (termed ComBatData) was an integrated dataset that included 832 patients with DLBCL; 470, 69, 221, and 72 were from GSE31312, GSE23501, GSE87371, and GSE98588, respectively. Among them, 263 patients had died (event) and 184 of them died within the first 2 years after diagnosis. The four datasets were merged using the ComBat method.
Identification of RNAs associated with long-term survival
The statistical process used in this study is illustrated in Figure 1. We divided the patients in the training dataset into an early event group and long-term survival group according to their survival time and status (death). To minimize confounding by baseline characteristics and to derive credible differentially expressed genes, we balanced baseline features between the two groups by exact matching analysis (Figure 2A). Before matching, age, Eastern Cooperative Oncology Group, Ann Arbor stage, treatment (CHOP vs. RCHOP), subtype (germinal center B-cell-like, GCB vs. non-GCB), and lactate dehydrogenase concentration were significantly different between the two groups. After matching, the baseline characteristics were well-balanced (Figure 2A). The volcano plot (Figure 2B, 2C) shows that 479 RNAs comprising 117 lncRNAs and 362 mRNAs were differentially expressed between the two groups; among them, 38 lncRNAs and 163 mRNAs were upregulated in the long-term survival group compared with the early event group. To construct the gene risk model, we used the 100 times procedure of the penalized Cox regression+stepwise and screened 25 RNAs (Table 1 and Figure 1; see Section 4.4 for details of the screening process). Stepwise elimination reduced the 25 RNAs to a subset of 11 RNAs (nine mRNAs and two lncRNAs), which was used in the final gene risk model. As shown in Table 1, nine of the 11 RNAs were selected 100 times in at least one penalized regression method; the other two RNAs were selected less frequently but exceeded 60 times in one penalized regression method. This result implied that the genes included in the final model were relatively insensitive to the regularization level of the penalized regression. The expression patterns of the 11 genes are presented in Figure 2D. The expression levels of five of the nine mRNAs, THOC1, EEF1A1, CCDC78, SLC35F4, and SLC43A2, and the two lncRNAs, ZNF252P-AS1 and SNHG16, were relatively low in the long-term survival group, whereas the expression levels of four of the mRNAs, CD1E, APBA2, PDK1, and NR3C1, were relatively high in the long-term survival group.
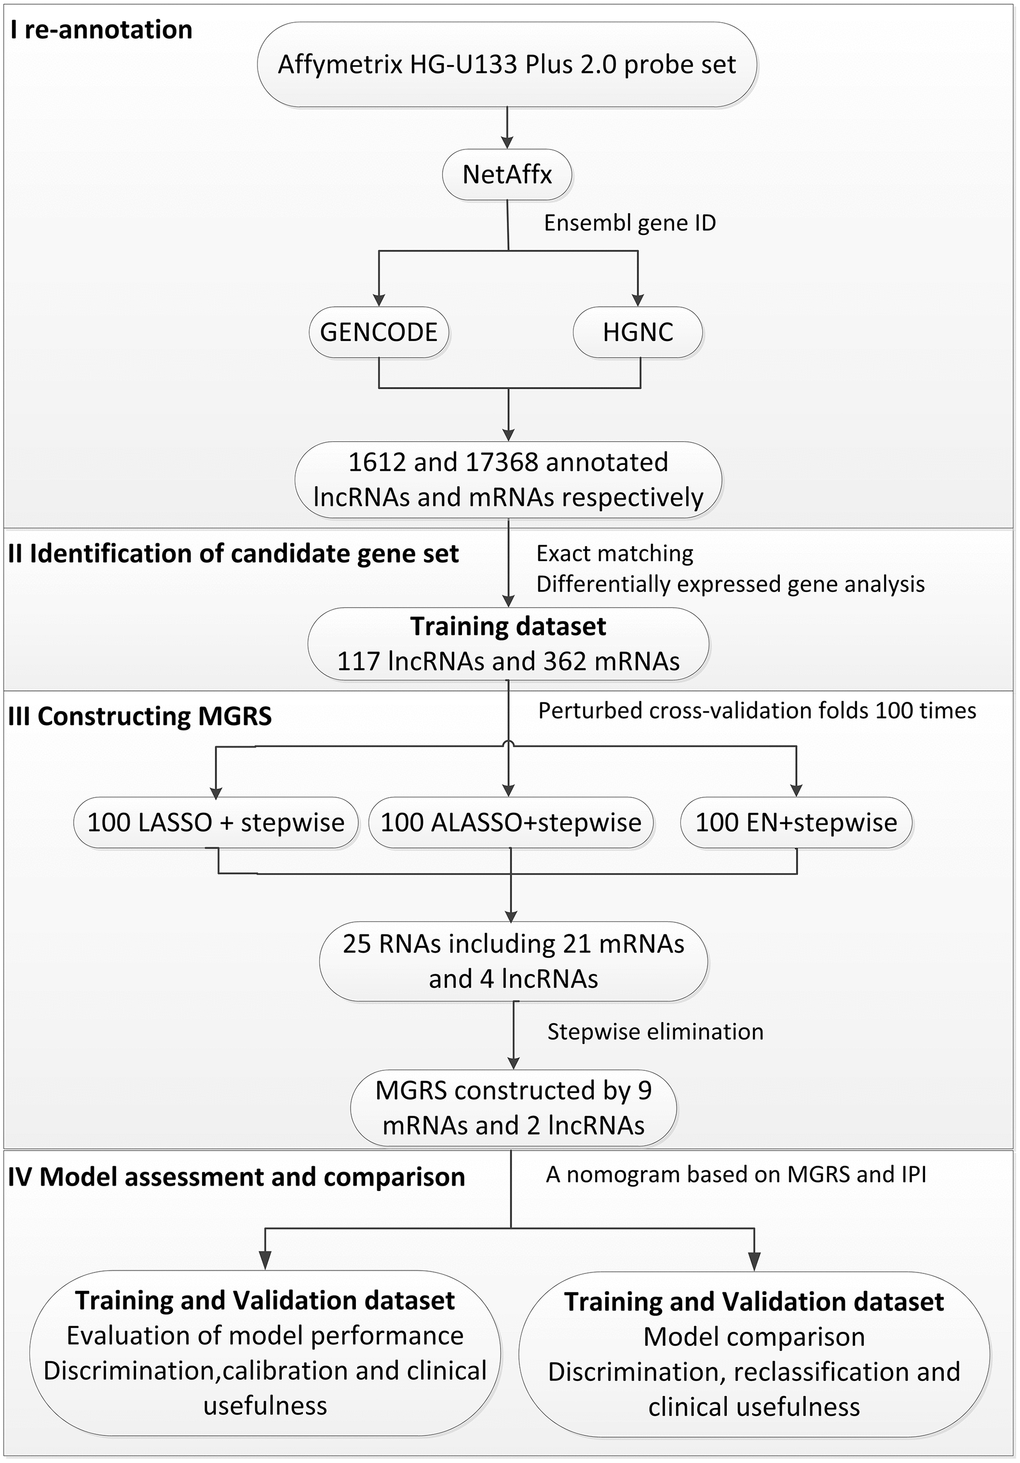
Figure 1. Flow chart of the statistical process used in this study.
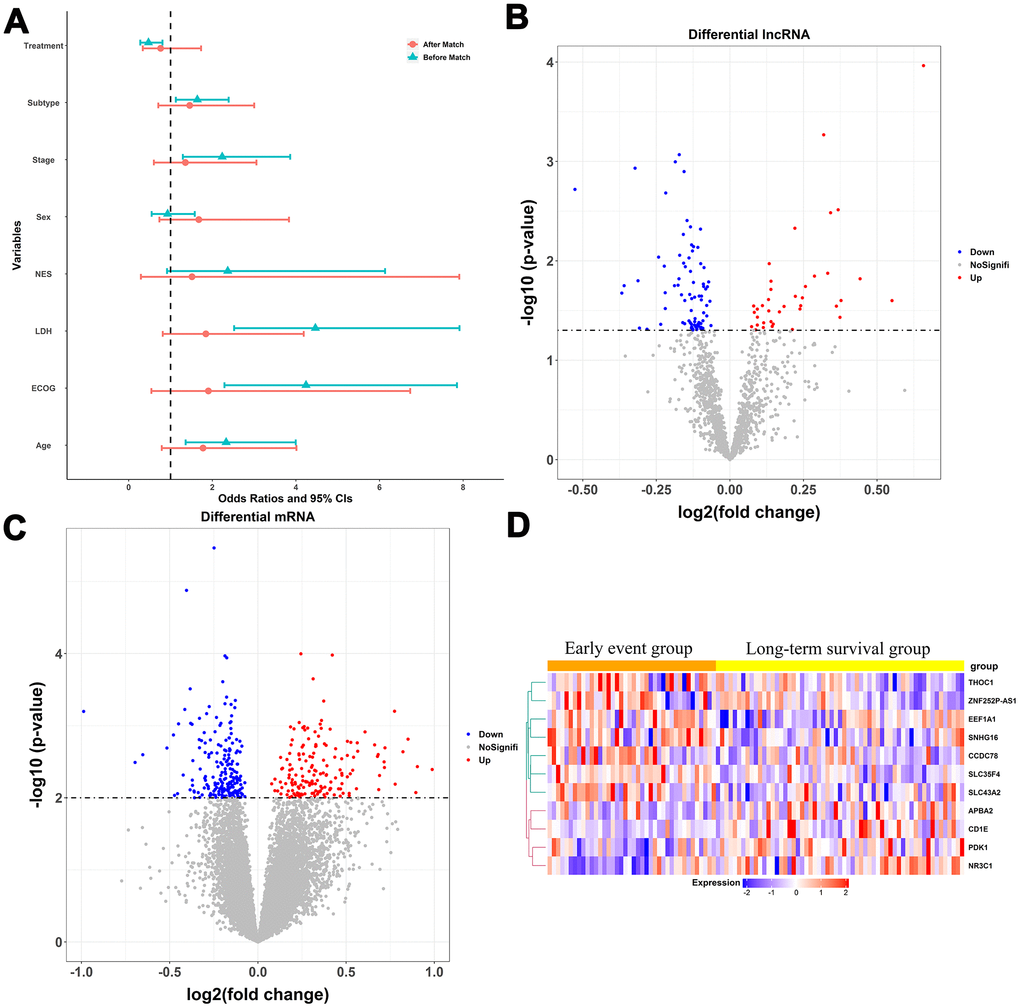
Figure 2. Construction of the multigene risk score (MGRS). (A) Baseline characteristics of patients in the early event and long-term survival groups before and after matching; ECOG, Eastern Cooperative Oncology Group; LDH, lactate dehydrogenase; NES, number of extra-nodal sites; Stage, Ann Arbor stage; (B, C) Volcano plots for differentially expressed lncRNAs and mRNAs in the long-term survival group compared with the early event group; (D) Expression patterns of the 11 RNAs included in the MGRS.
Table 1. Genes screened using the penalized regression method.
| Gene name | gene type | Selected times | |||||||||||||||||||||||||||||||||||||||||||||||||||||||||||||||||||||||||||||||||||||||||||||||||
| LASSO | ALASSO† | EN‡ | |||||||||||||||||||||||||||||||||||||||||||||||||||||||||||||||||||||||||||||||||||||||||||||||||
| ALDOC | mRNA | 100 | 45 | 100 | |||||||||||||||||||||||||||||||||||||||||||||||||||||||||||||||||||||||||||||||||||||||||||||||
| ANOS1 | mRNA | 100 | 100 | 100 | |||||||||||||||||||||||||||||||||||||||||||||||||||||||||||||||||||||||||||||||||||||||||||||||
| APBA2 | mRNA | 100 | 100 | 100 | |||||||||||||||||||||||||||||||||||||||||||||||||||||||||||||||||||||||||||||||||||||||||||||||
| CCDC78 | mRNA | 100 | 45 | 100 | |||||||||||||||||||||||||||||||||||||||||||||||||||||||||||||||||||||||||||||||||||||||||||||||
| CD1E | mRNA | 100 | 100 | 100 | |||||||||||||||||||||||||||||||||||||||||||||||||||||||||||||||||||||||||||||||||||||||||||||||
| DMD | mRNA | 100 | 37 | 100 | |||||||||||||||||||||||||||||||||||||||||||||||||||||||||||||||||||||||||||||||||||||||||||||||
| JAML | mRNA | 100 | 37 | 100 | |||||||||||||||||||||||||||||||||||||||||||||||||||||||||||||||||||||||||||||||||||||||||||||||
| NRROS | mRNA | 100 | 45 | 100 | |||||||||||||||||||||||||||||||||||||||||||||||||||||||||||||||||||||||||||||||||||||||||||||||
| SLC22A1 | mRNA | 100 | 37 | 100 | |||||||||||||||||||||||||||||||||||||||||||||||||||||||||||||||||||||||||||||||||||||||||||||||
| SLC35F4 | mRNA | 100 | 100 | 100 | |||||||||||||||||||||||||||||||||||||||||||||||||||||||||||||||||||||||||||||||||||||||||||||||
| SLC43A2 | mRNA | 100 | 100 | 100 | |||||||||||||||||||||||||||||||||||||||||||||||||||||||||||||||||||||||||||||||||||||||||||||||
| SNHG16 | lncRNA | 100 | 100 | 100 | |||||||||||||||||||||||||||||||||||||||||||||||||||||||||||||||||||||||||||||||||||||||||||||||
| THOC1 | mRNA | 100 | 100 | 100 | |||||||||||||||||||||||||||||||||||||||||||||||||||||||||||||||||||||||||||||||||||||||||||||||
| ZNF252P-AS1 | lncRNA | 100 | 100 | 100 | |||||||||||||||||||||||||||||||||||||||||||||||||||||||||||||||||||||||||||||||||||||||||||||||
| POMZP3 | mRNA | 72 | 0 | 100 | |||||||||||||||||||||||||||||||||||||||||||||||||||||||||||||||||||||||||||||||||||||||||||||||
| TSPOAP1-AS1 | lncRNA | 72 | 63 | 46 | |||||||||||||||||||||||||||||||||||||||||||||||||||||||||||||||||||||||||||||||||||||||||||||||
| ONECUT1 | mRNA | 71 | 37 | 6 | |||||||||||||||||||||||||||||||||||||||||||||||||||||||||||||||||||||||||||||||||||||||||||||||
| CBFA2T3 | mRNA | 57 | 37 | 94 | |||||||||||||||||||||||||||||||||||||||||||||||||||||||||||||||||||||||||||||||||||||||||||||||
| EEF1A1 | mRNA | 57 | 100 | 94 | |||||||||||||||||||||||||||||||||||||||||||||||||||||||||||||||||||||||||||||||||||||||||||||||
| DDX11-AS1 | lncRNA | 43 | 0 | 6 | |||||||||||||||||||||||||||||||||||||||||||||||||||||||||||||||||||||||||||||||||||||||||||||||
| GSTA4 | mRNA | 29 | 0 | 94 | |||||||||||||||||||||||||||||||||||||||||||||||||||||||||||||||||||||||||||||||||||||||||||||||
| NR3C1 | mRNA | 0 | 63 | 0 | |||||||||||||||||||||||||||||||||||||||||||||||||||||||||||||||||||||||||||||||||||||||||||||||
| PDK1 | mRNA | 0 | 63 | 0 | |||||||||||||||||||||||||||||||||||||||||||||||||||||||||||||||||||||||||||||||||||||||||||||||
| FAM49B | mRNA | 0 | 0 | 54 | |||||||||||||||||||||||||||||||||||||||||||||||||||||||||||||||||||||||||||||||||||||||||||||||
| DCAF5 | mRNA | 0 | 0 | 2 | |||||||||||||||||||||||||||||||||||||||||||||||||||||||||||||||||||||||||||||||||||||||||||||||
| †ALASSO: adaptive LASSO | |||||||||||||||||||||||||||||||||||||||||||||||||||||||||||||||||||||||||||||||||||||||||||||||||||
| ‡EN: elastic net | |||||||||||||||||||||||||||||||||||||||||||||||||||||||||||||||||||||||||||||||||||||||||||||||||||
Multigene risk score
The multigene risk score (MGRS) was defined as the prognostic index of multivariable Cox models constructed with the 11 selected RNAs. The MGRS can be represented as follows:
MGRS = −0.445 × CD1E + 0.243 × ZNF252P-AS1 − 0.346 × APBA2 + 0.258 × THOC1 + 0.346 × SNHG16 − 0.312 × NR3C1 + 0.213 × SLC35F4 − 0.318 × PDK1 + 0.202 × CCDC78 + 0.245 × SLC43A2 + 0.227 × EEF1A1.
The MGRS was calculated for each patient in the training dataset. The mean of the MGRSs was 0, which was defined as the cutoff value for dividing patients into MGRS-high risk or MGRS-low risk groups. Figure 3A shows the distribution of the MGRSs and survival status in the training dataset. The results indicate that patients with higher MGRSs had worse overall survival than patients with lower MGRSs. The 2-year survival rate for the patients with the higher MGRSs was 49.8% compared with 89.0% for patients with the lower MGRSs (hazard ratio (HR)=5.975, 95% CI 3.995–8.938, p <0.001; Figure 3C). The time-dependent receiver operating characteristic (ROC) curves at 1, 2, 3, and 5 years after diagnosis are shown in Figure 3E. The area under the ROC curve (AUC) at 2 years was 0.759.
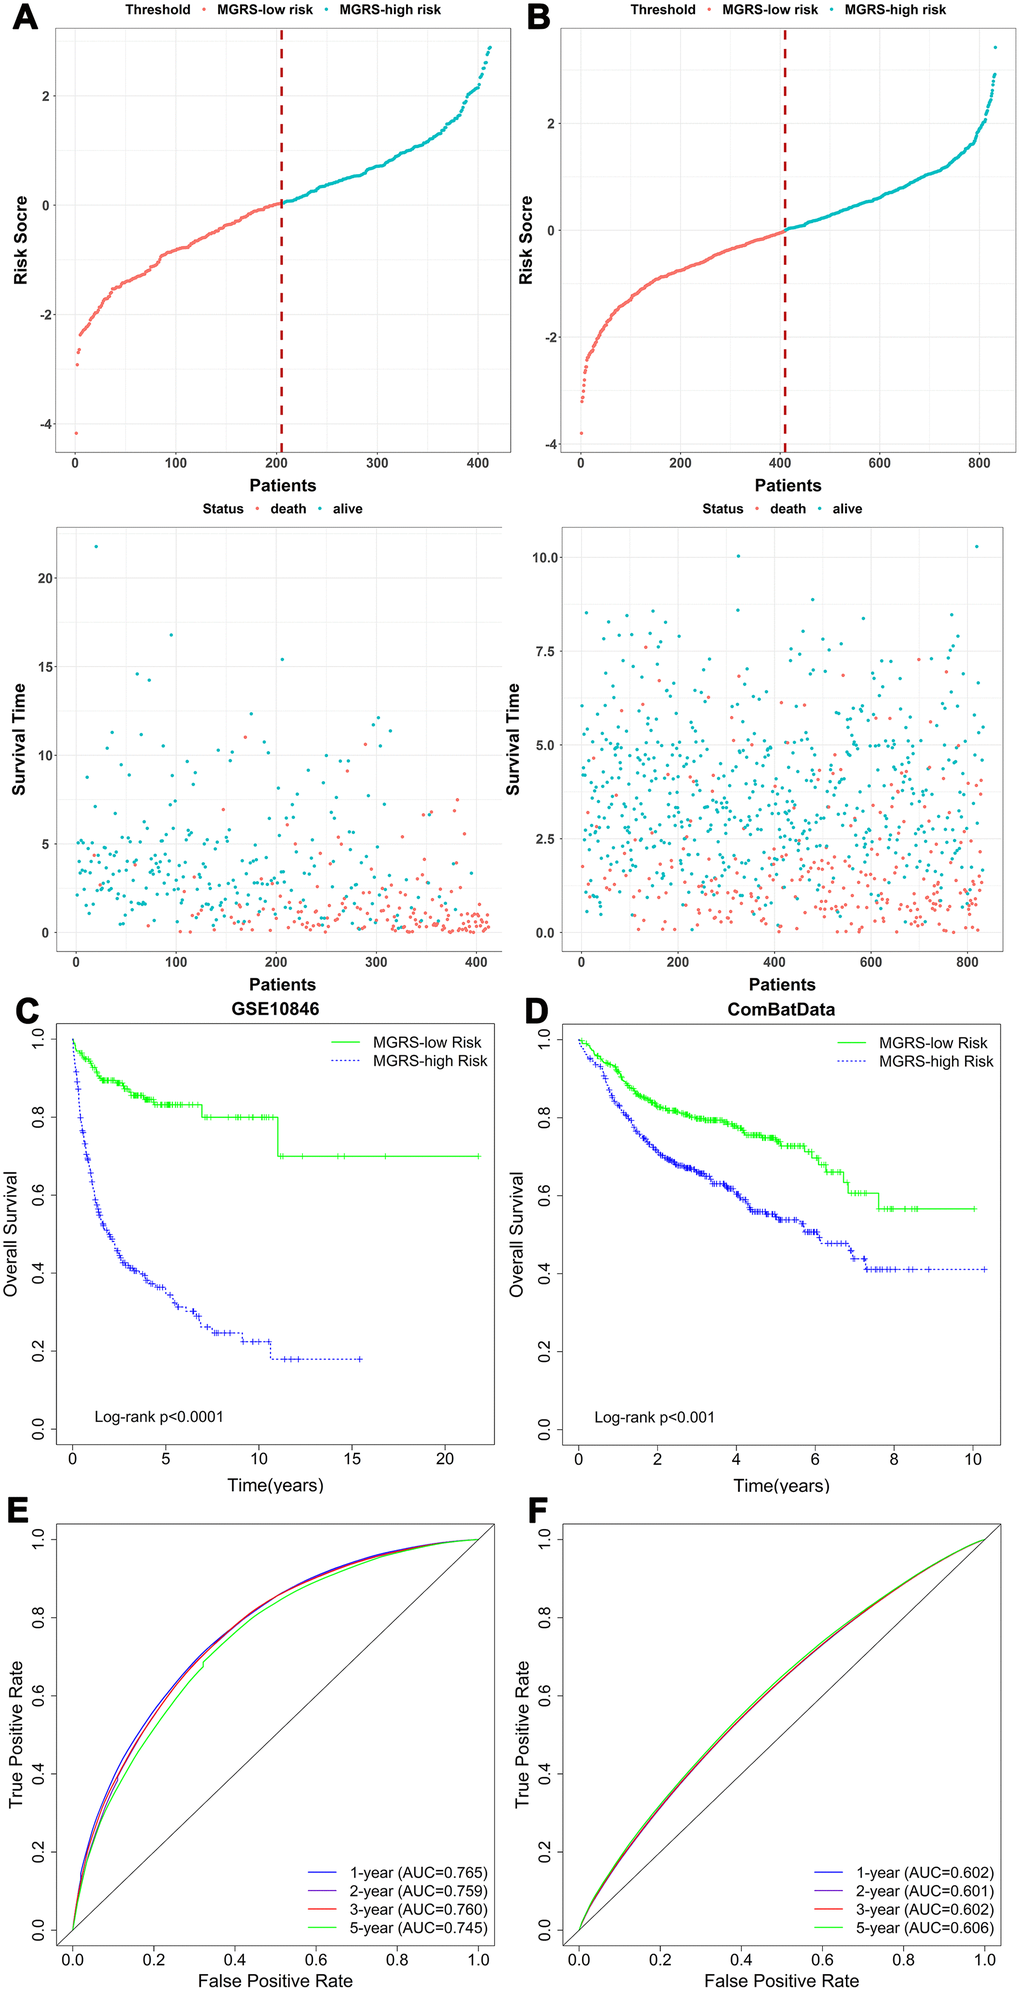
Figure 3. The relationship between multigene risk score (MGRS) and overall survival of patients with DLBCL. Distribution of MGRS and survival status in (A) the training dataset and (B) the validation dataset; (C, D) Kaplan–Meier survival curves of MGRS-high risk and MGRS-low risk groups in the training and validation datasets; (E, F) Time-dependent ROC curves at 1, 2, 3, and 5 years after diagnosis for the MGRS in the training and validation datasets.
The same analyses were conducted for the validation dataset (Figure 3B, 3D, 3F). Using the cutoff value determined with the training dataset, 410 (49.3%) and 422 (50.7%) patients were assigned to the MGRS-low and MGRS-high risk groups, respectively. The 2-year survival rates were 70.9% for patients in the MGRS-high risk group and 83.3% for patients in the MGRS-low risk group (HR=1.882, 95% CI 1.463–2.422, p <0.001; Figure 3D). The 2-year AUC for the validation dataset was 0.601.
Together, these results suggest that the MGRS has potential value in predicting 2-year survival of patients with DLBCL.
Independence of the MGRS in predicting long-term survival
Stratification analysis and multivariable Cox regression analysis were conducted to explore the independent role of the MGRS in predicting long-term survival. Patients in the training dataset were stratified based on the IPI (IPI ≥3/IPI ≤2), sex (female/male), subtype (GCB/non-GCB), and treatment (CHOP/RCHOP). Figure 4A–4H shows the Kaplan-Meier survival curves for the MGRS-high risk and MGRS-low risk groups within each stratum, which demonstrated that, in each subgroup, patients in the MGRS-high risk group had significantly worse prognosis than patients in the MGRS-low risk. Similar results were obtained for patients in the validation dataset (Figure 4I–4N). There were significant differences in overall survival between patients in the MGRS-high risk and MGRS-low risk groups in each subgroup, except for patients in the IPI ≥3 subgroup (p=0.09). However, the survival curve for the MGRS-high risk group was lower than the survival curve for the MGRS-low risk group in the IPI ≥3 subgroup, and the median survival time for patients in the MGRS-high risk group was 3.69 years. The median survival time for patients in the MGRS-low risk group was not reached.
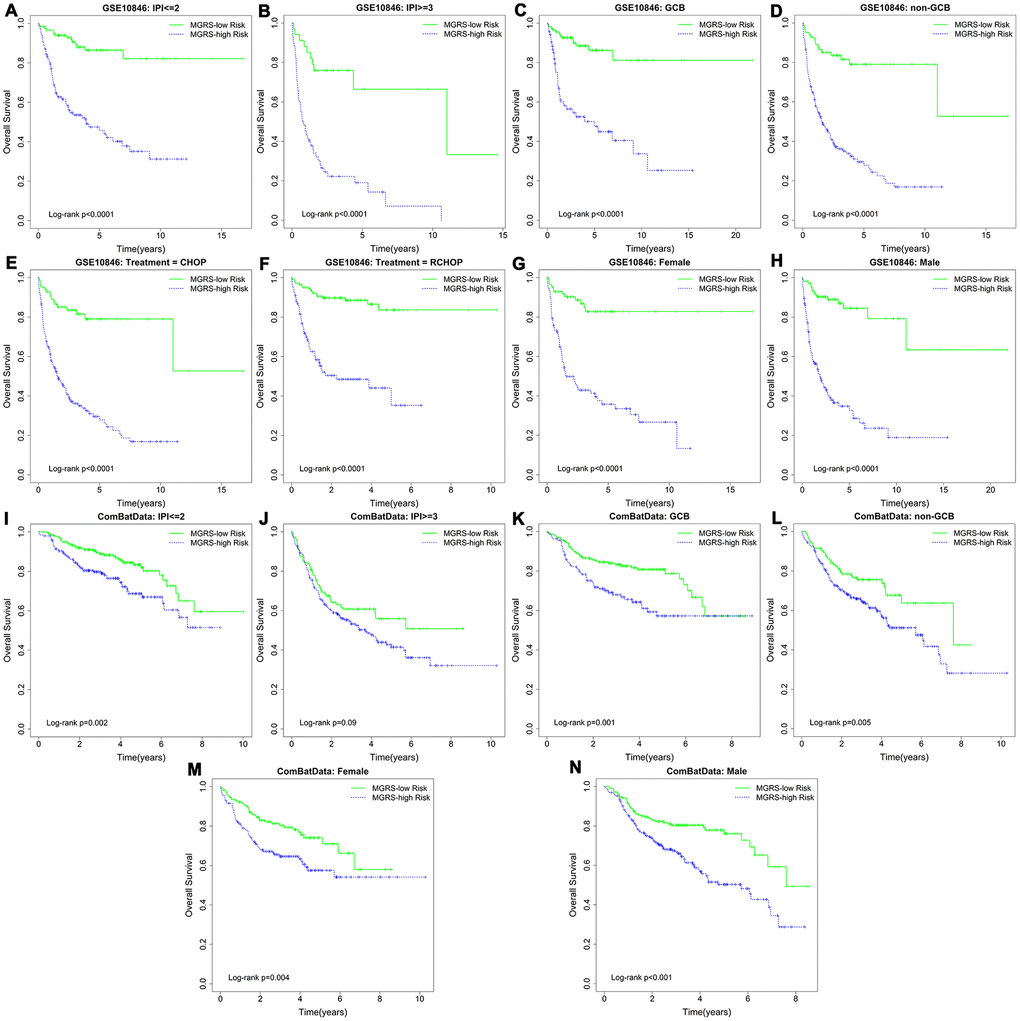
Figure 4. Kaplan–Meier survival curves of multigene risk score (MGRS)-high risk and MGRS-low risk groups stratified by clinical factors in the (A–H) training dataset and (I–N) validation dataset.
The hazard ratios (HRs) and corresponding model coefficients for the univariate and multivariable Cox model with stepwise procedure are summarized in Table 2. For the multivariable Cox regression model, we found that, after adjusting for the MGRSs, the HR of the IPI score was moderately reduced, suggesting that the 11 RNAs contained prognostic information that was at least partially independent of the IPI.
Table 2. Univariate and multivariable Cox regression with the training and validation datasets.
| Variables | Univariate analysis | Multivariable analysis | |||||||||||||||||||||||||||||||||||||||||||||||||||||||||||||||||||||||||||||||||||||||||||||||||
| β | SE (β) | HR (95%CI) | Wald χ2 | P | β | SE (β) | HR (95%CI) | Wald χ2 | P | ||||||||||||||||||||||||||||||||||||||||||||||||||||||||||||||||||||||||||||||||||||||||||
| GSE10866(n=412) | |||||||||||||||||||||||||||||||||||||||||||||||||||||||||||||||||||||||||||||||||||||||||||||||||||
| MGRS | 1.000 | 0.080 | 2.718 (2.319-3.185) | 152.60 | 4.68E-35 | 0.940 | 0.090 | 2.560 (2.145-3.057) | 108.07 | 2.60E-25 | |||||||||||||||||||||||||||||||||||||||||||||||||||||||||||||||||||||||||||||||||||||||||
| IPI (0-2 vs. 3-5) | 1.067 | 0.178 | 2.907 (2.051-4.120) | 35.97 | 2.00E-9 | 0.877 | 0.181 | 2.403 (1.686-3.423) | 23.56 | 1.21E-6 | |||||||||||||||||||||||||||||||||||||||||||||||||||||||||||||||||||||||||||||||||||||||||
| Subtype (GCB vs. non-GCB) | 0.854 | 0.172 | 2.349 (1.676-3.293) | 24.54 | 7.28E-7 | ||||||||||||||||||||||||||||||||||||||||||||||||||||||||||||||||||||||||||||||||||||||||||||||
| Treatment (RCHOP vs. CHOP) | -0.657 | 0.167 | 0.518 (0.374-0.719) | 15.48 | 8.33E-5 | ||||||||||||||||||||||||||||||||||||||||||||||||||||||||||||||||||||||||||||||||||||||||||||||
| Sex (female vs. male) | 0.010 | 0.163 | 1.010 (0.734-1.389) | 0 | 0.951 | - | - | - | - | - | |||||||||||||||||||||||||||||||||||||||||||||||||||||||||||||||||||||||||||||||||||||||||
| CombatData (n=832) | |||||||||||||||||||||||||||||||||||||||||||||||||||||||||||||||||||||||||||||||||||||||||||||||||||
| MGRS | 0.340 | 0.057 | 1.405 (1.256, 1.571) | 35.39 | 2.70E-09 | 0.233 | 0.061 | 1.262 (1.121, 1.422) | 14.72 | 0.0001 | |||||||||||||||||||||||||||||||||||||||||||||||||||||||||||||||||||||||||||||||||||||||||
| IPI (0-2 vs. 3-5) | 1.094 | 0.131 | 2.985 (2.310, 3.859) | 69.78 | 6.63E-17 | 0.963 | 0.135 | 2.620 (2.010, 3.415) | 50.81 | 1.02E-12 | |||||||||||||||||||||||||||||||||||||||||||||||||||||||||||||||||||||||||||||||||||||||||
| Subtype (GCB vs. non-GCB) | 0.455 | 0.133 | 1.576 (1.214, 2.045) | 11.66 | 0.0006 | - | - | - | - | - | |||||||||||||||||||||||||||||||||||||||||||||||||||||||||||||||||||||||||||||||||||||||||
| Sex (female vs. male) | 0.067 | 0.133 | 1.069 (0.825, 1.387) | 0.26 | 0.613 | - | - | - | - | - | |||||||||||||||||||||||||||||||||||||||||||||||||||||||||||||||||||||||||||||||||||||||||
| Notation: HR, hazard ratio; SE, standard error; CI, confidence interval; IPI, International Prognostic Index; GCB, germinal center B-cell-like; CHOP: cyclophosphamide, doxorubicin hydrochloride, vincristine, and prednisone; RCHOP: rituximab, cyclophosphamide, doxorubicin hydrochloride, vincristine, and prednisone. | |||||||||||||||||||||||||||||||||||||||||||||||||||||||||||||||||||||||||||||||||||||||||||||||||||
Evaluation and comparison of model performances
Nomograms were constructed for the training and validation dataset based on the results of the multivariable Cox regression model (Figure 5A). A nomogram is a quantitative tool that can be used in a clinical setting to predict 2-year survival rates of patients with DLBCL. Calibration plots of the nomogram with the training and validation datasets is shown in Figure 5B. The calibration plots showed that IPI+MGRS performed well with only a slight overestimation of the 2-year survival rate for the validation cohort in one of the three groups that were obtained by dividing the samples according to the quantile of the predicted absolute risk. Figure 5C shows the 2-year ROC curves for the IPI, MGRS, and IPI+MGRS models. With the training dataset, the AUC value at 2 years after diagnosis increased from 0.611 for the IPI model to 0.773 for the IPI+MGRS model (ΔAUC=0.162, 95% CI 0.1295–0.1903). The results were similar to the validation dataset; the AUC value at 2 years after diagnosis increased by 0.031 (95% CI 0.025–0.036) for the IPI+MGRS model compared with the value for the IPI model. A decision curve was used to assess the clinical usefulness of the nomogram. As shown in Figure 5D, the IPI+MGRS and IPI models both derived more net-benefit than the other two schemes: none of the patients were at 2-year death risk or all of the patients were at 2-year death risk. The net benefit of the IPI+MGRS model was higher than that of the IPI model.
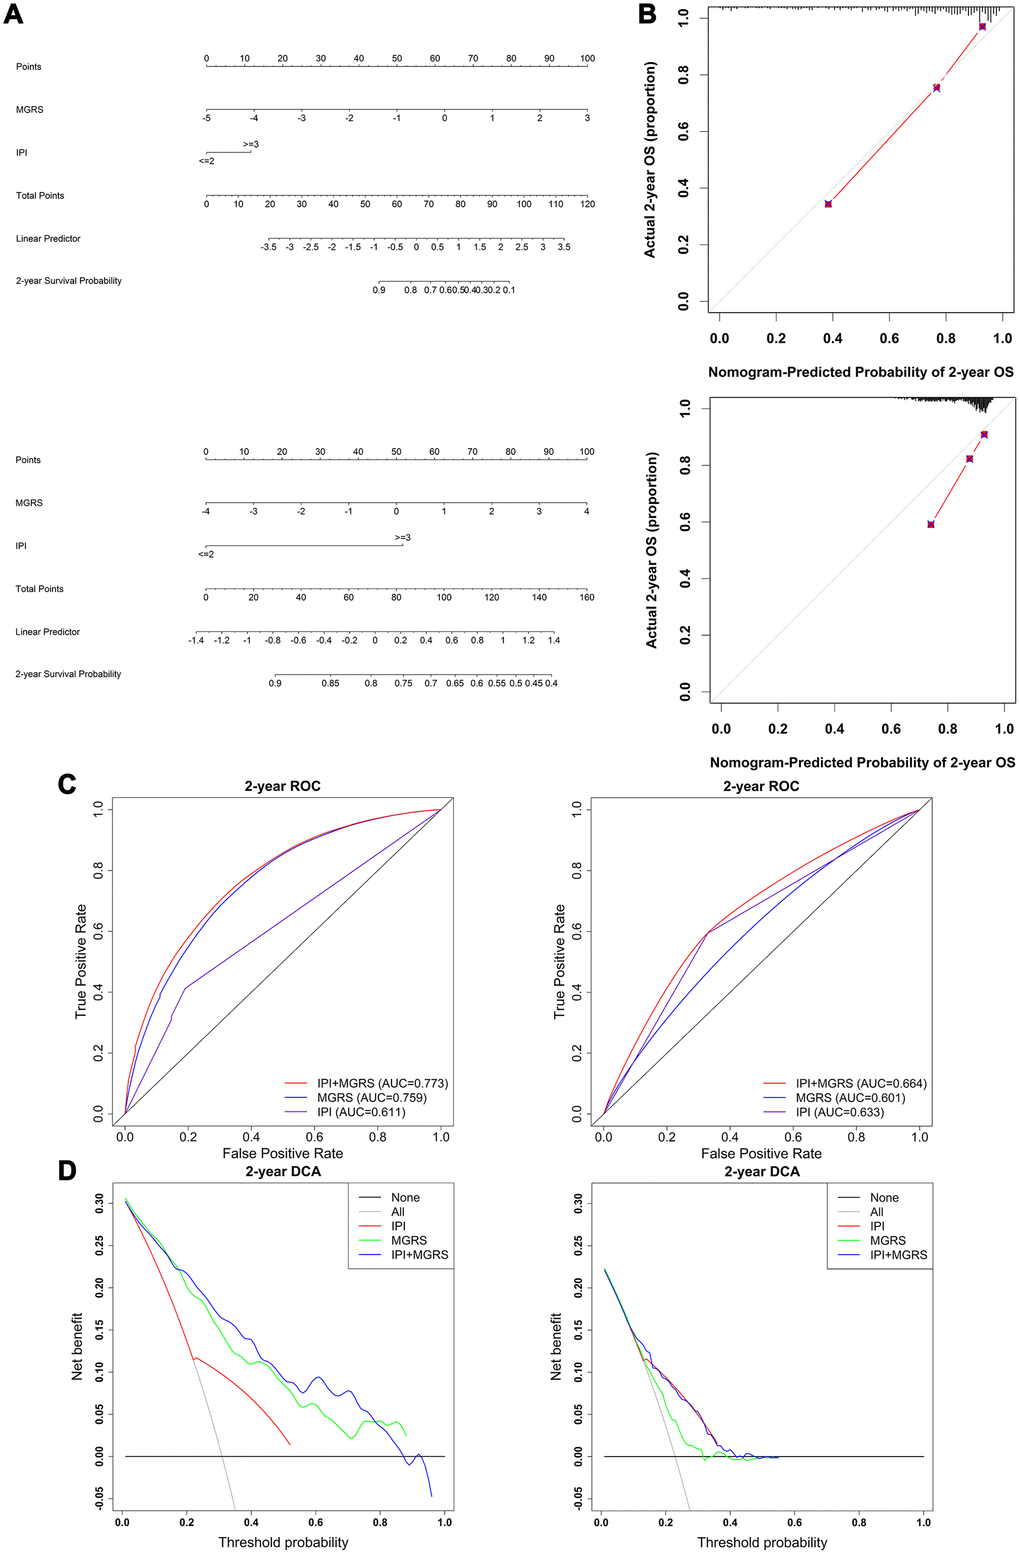
Figure 5. Evaluation and comparison of model performances in predicting 2-year survival. (A) Nomogram based on the International Prognostic Index (IPI) and multigene risk score (MGRS) with the training dataset (top panel) and validation dataset (bottom panel); (B) Calibration plot of the nomogram for estimation of survival rates at 2 years after diagnosis in the training dataset (top panel) and validation dataset (bottom panel); (C) Time-dependent ROC curves at 2 years after diagnosis for the IPI, MGRS, and IPI+MGRS models in the training dataset (left panel) and validation dataset (right panel); (D) Decision curves at 2 years after diagnosis for the IPI, MGRS, and IPI+MGRS models, in the training dataset (left panel) and validation dataset (right panel).
To further investigate the added predictive value from the MGRS, the category-free net reclassification index (NRI >0) was calculated to assess how much better the IPI+MGRS model was at predicting the 2-year death risk compared with the IPI model. For the training dataset, the IPI+MGRS model had an NRI (>0) of 0.894 (95% CI 0.6760–1.1211) and, for the validation dataset, the IPI+MGRS model had an NRI (>0) of 0.329 (95% CI 0.1675–0.4934).
The generalizability of the MGRS was investigated by sensitivity analysis using three different subsets of the validation dataset (termed ComBatData). The selected GEO dataset with the largest sample size (GSE31312) was defined as ComBatData1 (n=470); ComBatData without the GSE31312 dataset was defined as ComBatData2 (n=362); and ComBatData without datasets with sample sizes less than 100 (GSE98588 and GSE23501) was defined as ComBatData3 (n=691). The increments of AUC obtained by the MGRS were 0.038 (95% CI 0.0289–0.0468) for ComBatData1, 0.030 (95% CI 0.0224–0.0364) for ComBatData2, and 0.035 (95% CI 0.0284–0.0414) for ComBatData3. The NRIs (>0) for the IPI+MGRS model were 0.312 (95% CI 0.0994–0.5340), 0.325 (95% CI 0.0623–0.5780), and 0.337 (95% CI 0.1587–0.5101) for ComBatData1, 2, and 3, respectively.
These findings suggested that the model that combined IPI with MGRS had better predictive accuracy than the model that used only the IPI.
Functional role of the MGRS
To better understand the biological mechanism of the MGRS, we performed a weighted correlation network analysis to develop a co-expression network based on gene expression profiling. The co-expression network had eight modules (Figure 6A), and the module marked in red (Figure 6B) had the highest correlation with MGRS. The genes in this module were functionally annotated with Gene Ontology (GO) terms under the biological process category and KEGG pathways. The results indicated that the MGRSs were strong associated with cell cycle, DNA replication, and DNA repair (Figure 6C, 6D).
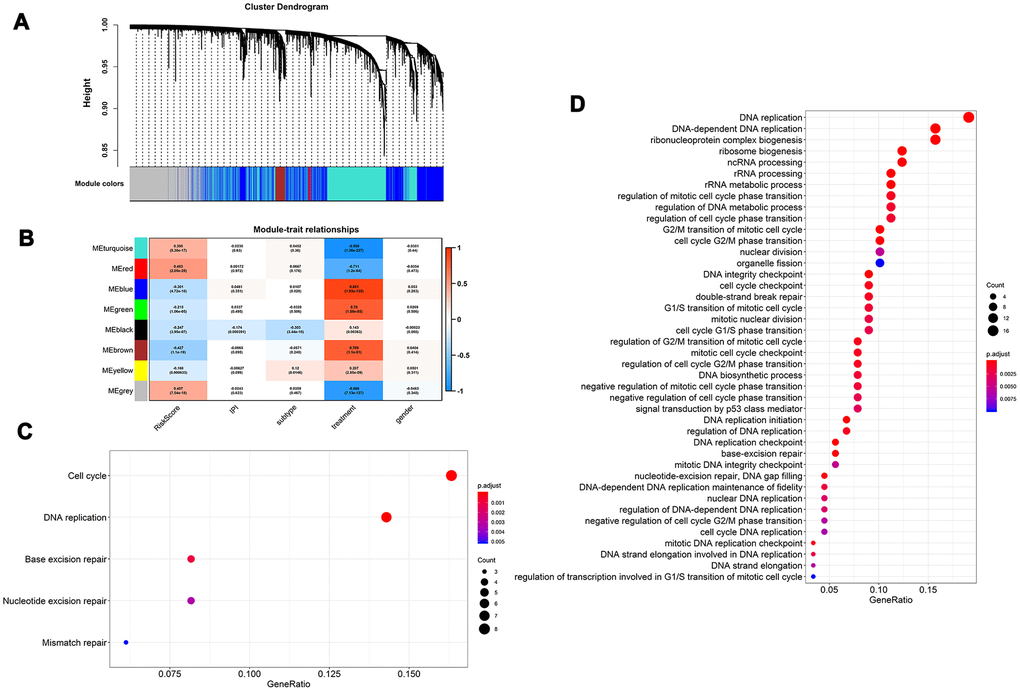
Figure 6. Functional role of multigene risk score (MGRS). Weighted gene co-expression network analysis: (A) Clustering dendrogram of genes and modules; (B) Correlation between gene modules and MGRS, clinical factors. The module marked in red had the highest correlation with MGRS; (C, D) Gene ontology (GO) and KEGG pathway analysis of the genes in the highly-correlated module.
Discussion
Several previous studies have identified molecular markers based on gene expression profiles for improving the predictive abilities of the IPI. For example, in 2004, Lossos et al. [15] constructed a predictive model based on the expression of six genes, the Lymphoma/Leukemia Molecular Profiling Project reported a three-component signature (about 400 genes) as a risk predictor [18] and, in 2011, Alizadeh et al. [17] further simplify the prognostic model to two genes. Hong et al. [19] assessed the usefulness of these gene-expression based signatures using discrimination and reclassification metrics and found that the improvement obtained by adding a gene expression-based signature to the IPI model was limited. Considering the important role of lncRNAs in the development and prognosis of cancers [23–27], in 2016, Sun et al. [30] built a prognostic model based on six lncRNAs. However, they assessed the predictive significance based only on the p values of a multivariable Cox regression. This type of assessment is not sufficient to evaluate the prediction accuracy of a prognostic model and to quantify the incremental usefulness offered by their six-lncRNA signature. The prediction capability of such a model should be assessed internally and externally in terms of discrimination and calibration [31–33]. To assess the added usefulness offered by new markers, improvement of discriminative ability and net reclassification metric also need to be calculated to determine how much better a model with new markers is at predicting risk compared with the model without new markers [32–34]. Importantly, no previous study combined mRNAs and lncRNAs to construct a signature to predict early event and long-term survival of patients with DLBCL. Considering these limitations, we reanalyzed the transcriptome data of DLBCL and evaluated the added value of integrating a mRNA–lncRNA signature using discrimination, clinical usefulness, and reclassification metrics.
Our robust statistical strategy produced a MGRS based on nine mRNAs and two lncRNAs. Stratification analysis and multivariable Cox regression analysis revealed that the MGRS provided prognostic information that was independent of the IPI. According to the results of multivariable Cox analysis, a nomogram was constructed by integrating the IPI and MGRS. The prediction efficiency of the nomogram was confirmed by the calibration plot. The nomogram may help clinicians identify high-risk patients with DLBCL. To evaluate the added value from the MGRS in 2-year survival prediction, we compared the performances of the IPI+MGRS and IPI models by assessing their discrimination, reclassification, and clinical usefulness. The addition of the MGRS to the IPI improved the discrimination and net reclassification performance. The decision curve showed that the IPI+MGRS model had better clinical practicality than the IPI model. Together, these results indicated that the MGRS can be used to refine the IPI model. These results were validated with an independent external dataset. However, the added value offered by the MGRS for the validation dataset was modest compared with the added value for the training dataset. This may be because the development of the MGRS relied on the training dataset [35] and the sample mix in the validation dataset was different but related to the training samples [36]. Sensitivity analysis showed similar results to the validation dataset. These findings indicated the broad applicability of the MGRS in DLBCL.
The functional enrichment analysis revealed a strong association between the MGRS and cell cycle, DNA replication, and DNA repair. We investigated the relationship between the genes included in the MGRS and cancer (summarized in Table 3). Six of the nine mRNAs included in the signature have been reported to be associated with cancer. PDK1 encodes pyruvate dehydrogenase kinase 1, which inactivates the pyruvate dehydrogenase (PDH) enzyme complex that converts pyruvate to acetyl-coenzyme A, thereby inhibiting pyruvate metabolism via the tricarboxylic acid (TCA) cycle [37]. Thomas et al. [38] showed that inhibition of the PDH enzyme complex caused by increased PDK1 expression was associated with the Warburg metabolic and malignant phenotype of cancer, and that knockdown of PDK1 decreased invasiveness and inhibited tumor growth. The prognostic performance of PDK1 varied among different cancers. Overexpression of PDK1 has been associated with poor prognosis in non-small cell lung cancer [39], nasopharyngeal carcinoma [40], and head and neck squamous cancer [41], whereas Shinkyo et al. [42] found that increased expression of PDK1 prolonged survival in colon cancer, which is consistent with our findings. The inconsistency in prognostic values for different cancers is poorly understood and needs further investigation. Eukaryotic translation elongation factor 1A1 (eEF1A1), encoded by EEF1A1, is an evolutionarily conserved elongation factor protein that triggers the initiation of protein translation elongation [43]. eEF1A1 is involved in multiple biological processes, including cytoskeletal remodeling, proteasome-mediated protein degradation, and control of cell cycle, growth, and death [44]. Aberrantly upregulated eEF1A1 has been detected in many tumor tissues and overexpression of eEF1A1 is related to cancer cell proliferation, invasion, and migration [45]. NR3C1 encodes glucocorticoid receptor (GR), which was shown to be involved in inflammatory responses, cellular proliferation, and differentiation in target tissues [46]. The expression of NR3C1 was found to be reduced in many tumor tissues owing to methylation of its promoter [47, 48]. For prognostic performance, high GR expression levels were associated with poor outcomes in estrogen-negative (ER−) breast and ovarian cancers, and with prolonged survival in ER+ breast cancer [49, 50]. In this study, we identified overexpression of NR3C1 as a predictor to predict better outcomes. NR3C1 may be a good prognostic factor because overexpressed GR has been shown to reduce glucocorticosteroid resistance in chemotherapy [51]. THO complex 1 (Thoc1) is a nuclear matrix protein that plays important roles in transcription elongation and mRNA export [52], and increased expression of Thoc1 was found in a number of tumors and correlated with poor prognosis [53–55]. APBA2 encodes a tumor suppressor and was found to be hypermethylated in various cancers [56–58], and SLC43A2 was reported to be associated with gastric cancer [59]; however, the prognostic value of these two genes is unclear. We found that high expression of APBA2 and low expression of SLC43A2 were associated with long-term survival in patients with DLBCL. The carcinogenic and prognostic mechanisms of APBA2 and SLC43A2 require further exploration. Of the two lncRNA included in the prognostic signatures, only SNHG16 has been reported to be associated with tumorigenesis and prognosis. SNHG16 was highly expressed in several cancers and silencing it inhibited cell proliferation, migration, and invasion, and induced apoptosis [60, 61]. In agreement with our results, previous survival analysis showed that patients with high SNHG16 expression had shorter survival times for various cancers [60, 61]. The relationships between the other three mRNAs and lncRNA ZNF252P-AS1 and cancer have not been reported until now, so further research is needed to clarify their potential functions in cancer.
Table 3. Relationship between the genes included in the multigene risk score (MGRS) and cancers.
| Gene names | Gene type | Potential roles in tumorigenesis and tumor progression | Relationship between overexpression/ overabundance with cancer prognosis |
| PDK1 | mRNA | 1. Upregulated PDK1 was associated with Warburg metabolic and malignant phenotype of cancer [38]; | 1.shorter survival: non-small cell lung cancer [39], nasopharyngeal carcinoma[40], and head and neck squamous cancer [41] |
| 2. Knockdown of PDK1 decreased invasiveness and inhibited tumor growth [38] | 2. prolonged survival: Colon Cancer [42] | ||
| EEF1A1 | mRNA | Overexpression of eEF1A1: related to cancer cell proliferation, invasion, and migration [45] | |
| NR3C1 | mRNA | Downregulation due to methylation: breast cancer [47], colorectal tumors [48] | 1. shorter survival: Estrogen-negative (ER-) breast cancer [49], ovarian cancer [50] |
| 2. prolonged survival: ER+ breast cancer [49] | |||
| THOC1 | mRNA | 1. Upregulated in colorectal cancer [53], breast cancer [54], and cancer cell [54] | 1. shorter survival: colorectal cancer [53] |
| 2. High Thoc1 expression associated with prostate cancer aggressiveness and recurrence [55] | |||
| APBA2 | mRNA | 1. Hypermethylated in gastric cancer [56], colorectal carcinoma and gastric carcinoma [57, 58] | |
| 2. Upregulated in early Endometrial endometrioid carcinoma [57] | |||
| SLC43A2 | mRNA | Associated with gastric cancer [59] | |
| SNHG16 | lncRNA | 1. Overexpression in non-small cell lung cancer [60] and oral squamous cell carcinoma [61]. | 1. shorter survival: non-small cell lung cancer [60] |
| 2. Associated with cancer cell proliferation, migration and invasion [60, 61] |
Our study has some limitations. First, all of the results derived in this study were based on publicly available datasets and lacked validation in a prospective clinical trial. Second, the carcinogenic and prognostic roles of the RNAs in the signature need to be validated in future studies.
In conclusion, we developed an integrated mRNA–lncRNA signature for predicting the long-term survival of patients with DLBCL. The addition of the MGRS improved the prognostic abilities of the IPI model. Future prospective clinical trials and basic research are needed to consolidate the validity of the proposed integrated mRNA–lncRNA signature.
Materials and Methods
Selection of DLBCL datasets
We systematically searched the GEO database (https://www.ncbi.nlm.nih.gov/geo/) for DLBCL expression profiling studies (June 2020) with the search term “((Expression profiling by array [DataSet Type]) AND DLBCL) AND Homo sapiens [Organism]”. Studies were included if they met the following criteria: (i) patients were newly diagnosed with primary DLBCL; (ii) gene expression profiling were conducted in pretreatment tumor tissue using the Affymetrix HU133 Plus 2.0 microarray (HG-U133 Plus_2.0); and (iii) the IPI and overall survival information were available. Five datasets were selected, GSE10846 [18], GSE31312 [62], GSE23501 [63], GSE87371 [64], and GSE98588 [65]. The selection process is illustrated in Supplementary Figure 1. After removing patients with missing overall survival information, a total of 1244 patients with DLBCL were selected and reanalyzed. They included 412 patients from GSE10846, 470 from GSE31312, 69 from GSE23501, 221 from GSE87371 and 72 from GSE98588. GSE10846 was used as the training dataset. GSE31312, GSE23501, GSE87371 and GSE98588 were merged using the ComBat method [66] and used as the external validation dataset (termed ComBatData). ComBat is a widely used and effective method to remove potential batch effects across different studies.
Preprocessing and re-annotating the gene expression profiles
Raw CEL files of the five selected GEO studies were downloaded from the GEO database. Each dataset was background-adjusted, normalized, and summarized using the robust multi-array average (RMA) algorithm [67]. To obtain the lncRNA and mRNA expression profiles, we re-annotated the microarray probes as described previously [68, 69]. Briefly, the Affymetrix HG-U133 Plus 2.0 probe set ID was mapped to the NetAffx Annotation Files (HG-U133 Plus 2.0 Annotations, CSV format, release 36, 07/12/16). Probe sets with an Ensembl gene ID in the NetAffx annotation were extracted. Using the Ensembl gene ID, we obtained the relationship between the probe set ID and the corresponding gene type and gene symbol using GENCODE (release 23; https://www.gencodegenes.org/) and HGNC (https://www.genenames.org/). Finally, we obtained 1612 annotated lncRNAs and 17,368 annotated mRNAs. When multiple probes were annotated to a common gene, the mean of the multiple probes was used to estimate the expression of the RNA.
Identification of early event associated mRNAs and lncRNAs
In this study, the early event was defined as death in the first 2 years after diagnosis [3]. Patients in the training dataset were divided into an early event group and long-term survival group. The long-term survival group included patients who survived for more than 2 years and survived during follow-up. To balance the clinical characteristics between these two groups and enable a robust and credible comparison of gene expression levels, we performed exact matching analysis [70]. The variables that were matched were age, sex, Eastern Cooperative Oncology Group performance status, number of extra-nodal sites, Ann Arbor stage, lactate dehydrogenase concentration, treatment (CHOP vs. R-CHOP), and subtype (germinal center B-cell-like, GCB vs. non-GCB). Forty patients in the early event group were matched to 59 patients in the long-term survival group. Liner models and empirical Bayes methods were used to identify differentially expressed lncRNAs and mRNAs, and the thresholds were p <0.05 and p <0.01 respectively [29, 71]. The differentially expressed RNAs were considered as candidate genes to construct the multigene risk score (MGRS).
Development and assessment of MGRS
Penalized regression methods, including least absolute shrinkage and selection operator (LASSO), ALASSO (adaptive LASSO), and elastic net (EN), were used to screen the variables (mRNAs and lncRNAs) to construct the MGRS. The tuning parameter λ of the penalized regression methods was determined by the rule of minimum mean cross-validated error. We performed the stepwise variables selection strategy in the Cox model to remove genes that were not significant predictors in the absence of the constraint imposed by the penalty [72]. To reduce the sensitivity of the variable selection procedure to the cross-validation process in the penalized regression, we repeated the selection strategy (penalized Cox regression+stepwise) 100 times with different cross-validation folds [72]. We used the set of 100 times penalized Cox regression+stepwise selected genes to construct a multivariable Cox model and defined its prognostic index as the MGRS. Patients from the different dataset were divided into MGRS-high risk and MGRS-low risk groups according to whether their MGRS was above or below the cutoff point, which was defined as the mean of the MGRSs in the training dataset.
To evaluate the independent role of the MGRS in prognosis, data stratification analysis and multivariable Cox regression analysis were performed. For the stratification analysis, Kaplan–Meier and log-rank tests were applied to compare the difference in survival between the MGRS-high risk and MGRS-low risk groups in each stratum. Then, we constructed a nomogram based on the results of the multivariable Cox analysis for clinical use [73]. The performance of the nomogram that integrated the IPI and MGRS in predicting 2-year survival was evaluated by its discrimination, calibration, and clinical usefulness [32]. Discrimination was measured by ROC curves [32, 74] at 2 years after diagnosis. Model calibration was assessed by comparing the observed 2-year survival rate with the mean of the predicted 2-year survival rate [32]. The observed 2-year survival rate was estimated using the Kaplan-Meier method. A model was considered well calibrated if the predicted 2-year survival rate was close to the observed one. The clinical usefulness of the model was assessed by decision curve analysis [32]. We also assessed the added value from the MGRS in the 2-year survival prediction by comparing the performance of the models with and without MGRS. The category-free net reclassification index (NRI>0) was used to quantify the ability of the IPI+MGRS model to correctly reclassify patients (survival or death at 2-year) comparing with that of the IPI model [32]. The NRI (>0) ranged from −2 to +2. A positive value of NRI (>0) indicated improved reclassification ability of the IPI+MGRS model.
To further investigate the generalizability of the MGRS, we also performed sensitivity analysis on three subsets of the validation dataset: ComBatData1, which contained the biggest dataset GSE31312; ComBatData2, which contained validation dataset without GSE31312; and ComBatData3, which contained the validation dataset without the datasets with sample size less than 100 (GSE98588 and GSE23501). The added value offered by MGRS was assessed in the sensitivity analysis.
Functional enrichment analysis
To explore the functional role of MGRS in patients with DLBCL, we constructed a co-expression network by weighted correlation network analysis [75]. Then, the correlation between the MGRS and each module in the co-expression network was estimated to identify highly-correlated modules. The genes in the highly-correlated module were functionally annotated by GO and KEGG pathway enrichment analysis [76]. Pathways with adjusted p <0.05 and nominal p <0.01 were considered statistically significant.
All the statistical analyses were performed using R-3.5.1 and SAS (version 9.4). A flow chart of the statistical process is given in Figure 1.
Author Contributions
TW was responsible for the study design, manuscript preparation and critically revising the manuscript. QG participated in the study design, and conducted data cleaning, statistical analysis and drafting manuscript. ZYL, LXM and JSM helped with data cleaning and statistical analysis. YFX participated in the study design and the explanation of the results. All authors approved the final manuscript.
Acknowledgments
The datasets analyzed in the current study are available in the Gene Expression Omnibus database under accession numbers GSE10846, GSE31312, GSE87371, GSE98588, and GSE23501.
We thank Margaret Biswas, PhD, from Liwen Bianji, Edanz Editing China (www.liwenbianji.cn/ac), for editing the English text of a draft of this manuscript.
Conflicts of Interest
The authors confirm that there are no conflicts of interest.
Funding
This work was supported by the National Natural Science Foundation of China, item number: 81872715 and 81473073.
References
- 1. Menon MP, Pittaluga S, Jaffe ES. The histological and biological spectrum of diffuse large B-cell lymphoma in the World Health Organization classification. Cancer J. 2012; 18:411–20. https://doi.org/10.1097/PPO.0b013e31826aee97 [PubMed]
- 2. Younes A. Prognostic significance of diffuse large b-cell lymphoma cell of origin: seeing the forest and the trees. J Clin Oncol. 2015; 33:2835–36. https://doi.org/10.1200/JCO.2015.61.9288 [PubMed]
- 3. Ekberg S, Jerkeman M, Andersson PO, Enblad G, Wahlin BE, Hasselblom S, Andersson TM, Eloranta S, Smedby KE. Long-term survival and loss in expectancy of life in a population-based cohort of 7114 patients with diffuse large b-cell lymphoma. Am J Hematol. 2018; 93:1020–28. https://doi.org/10.1002/ajh.25147 [PubMed]
- 4. Maurer MJ, Habermann TM, Shi Q, Schmitz N, Cunningham D, Pfreundschuh M, Seymour JF, Jaeger U, Haioun C, Tilly H, Ghesquieres H, Merli F, Ziepert M, et al. Progression-free survival at 24 months (PFS24) and subsequent outcome for patients with diffuse large b-cell lymphoma (DLBCL) enrolled on randomized clinical trials. Ann Oncol. 2018; 29:1822–27. https://doi.org/10.1093/annonc/mdy203 [PubMed]
- 5. Jakobsen LH, Bøgsted M, Brown PN, Arboe B, Jørgensen J, Larsen TS, Juul MB, Schurmann L, Højberg L, Bergmann OJ, Lassen T, Josefsson PL, Jensen P, et al. Minimal loss of lifetime for patients with diffuse large b-cell lymphoma in remission and event free 24 months after treatment: a danish population-based study. J Clin Oncol. 2017; 35:778–84. https://doi.org/10.1200/JCO.2016.70.0765 [PubMed]
- 6. Maurer MJ, Ghesquières H, Jais JP, Witzig TE, Haioun C, Thompson CA, Delarue R, Micallef IN, Peyrade F, Macon WR, Jo Molina T, Ketterer N, Syrbu SI, et al. Event-free survival at 24 months is a robust end point for disease-related outcome in diffuse large b-cell lymphoma treated with immunochemotherapy. J Clin Oncol. 2014; 32:1066–73. https://doi.org/10.1200/JCO.2013.51.5866 [PubMed]
- 7. International Non-Hodgkin’s Lymphoma Prognostic Factors Project. A predictive model for aggressive non-Hodgkin’s lymphoma. N Engl J Med. 1993; 329:987–94. https://doi.org/10.1056/NEJM199309303291402 [PubMed]
- 8. Wight JC, Chong G, Grigg AP, Hawkes EA. Prognostication of diffuse large b-cell lymphoma in the molecular era: moving beyond the IPI. Blood Rev. 2018; 32:400–15. https://doi.org/10.1016/j.blre.2018.03.005 [PubMed]
- 9. Biccler J, Eloranta S, de Nully Brown P, Frederiksen H, Jerkeman M, Smedby KE, Bøgsted M, El-Galaly TC. Simplicity at the cost of predictive accuracy in diffuse large b-cell lymphoma: a critical assessment of the R-IPI, IPI, and NCCN-IPI. Cancer Med. 2018; 7:114–22. https://doi.org/10.1002/cam4.1271 [PubMed]
- 10. Swerdlow SH, Campo E, Pileri SA, Harris NL, Stein H, Siebert R, Advani R, Ghielmini M, Salles GA, Zelenetz AD, Jaffe ES. The 2016 revision of the World Health Organization classification of lymphoid neoplasms. Blood. 2016; 127:2375–90. https://doi.org/10.1182/blood-2016-01-643569 [PubMed]
- 11. Sesques P, Johnson NA. Approach to the diagnosis and treatment of high-grade B-cell lymphomas with MYC and BCL2 and/or BCL6 rearrangements. Blood. 2017; 129:280–88. https://doi.org/10.1182/blood-2016-02-636316 [PubMed]
- 12. Rosenthal A, Younes A. High grade B-cell lymphoma with rearrangements of MYC and BCL2 and/or BCL6: double hit and triple hit lymphomas and double expressing lymphoma. Blood Rev. 2017; 31:37–42. https://doi.org/10.1016/j.blre.2016.09.004 [PubMed]
- 13. Clipson A, Barrans S, Zeng N, Crouch S, Grigoropoulos NF, Liu H, Kocialkowski S, Wang M, Huang Y, Worrillow L, Goodlad J, Buxton J, Neat M, et al. The prognosis of MYC translocation positive diffuse large B-cell lymphoma depends on the second hit. J Pathol Clin Res. 2015; 1:125–33. https://doi.org/10.1002/cjp2.10 [PubMed]
- 14. Lossos IS, Morgensztern D. Prognostic biomarkers in diffuse large B-cell lymphoma. J Clin Oncol. 2006; 24:995–1007. https://doi.org/10.1200/JCO.2005.02.4786 [PubMed]
- 15. Lossos IS, Czerwinski DK, Alizadeh AA, Wechser MA, Tibshirani R, Botstein D, Levy R. Prediction of survival in diffuse large-B-cell lymphoma based on the expression of six genes. N Engl J Med. 2004; 350:1828–37. https://doi.org/10.1056/NEJMoa032520 [PubMed]
- 16. Rosenwald A, Wright G, Chan WC, Connors JM, Campo E, Fisher RI, Gascoyne RD, Muller-Hermelink HK, Smeland EB, Giltnane JM, Hurt EM, Zhao H, Averett L, et al, and Lymphoma/Leukemia Molecular Profiling Project. The use of molecular profiling to predict survival after chemotherapy for diffuse large-B-cell lymphoma. N Engl J Med. 2002; 346:1937–47. https://doi.org/10.1056/NEJMoa012914 [PubMed]
- 17. Alizadeh AA, Gentles AJ, Alencar AJ, Liu CL, Kohrt HE, Houot R, Goldstein MJ, Zhao S, Natkunam Y, Advani RH, Gascoyne RD, Briones J, Tibshirani RJ, et al. Prediction of survival in diffuse large B-cell lymphoma based on the expression of 2 genes reflecting tumor and microenvironment. Blood. 2011; 118:1350–58. https://doi.org/10.1182/blood-2011-03-345272 [PubMed]
- 18. Lenz G, Wright G, Dave SS, Xiao W, Powell J, Zhao H, Xu W, Tan B, Goldschmidt N, Iqbal J, Vose J, Bast M, Fu K, et al, and Lymphoma/Leukemia Molecular Profiling Project. Stromal gene signatures in large-B-cell lymphomas. N Engl J Med. 2008; 359:2313–23. https://doi.org/10.1056/NEJMoa0802885 [PubMed]
- 19. Hong F, Kahl BS, Gray R. Incremental value in outcome prediction with gene expression-based signatures in diffuse large B-cell lymphoma. Blood. 2013; 121:156–58. https://doi.org/10.1182/blood-2012-08-450106 [PubMed]
- 20. Fatica A, Bozzoni I. Long non-coding RNAs: new players in cell differentiation and development. Nat Rev Genet. 2014; 15:7–21. https://doi.org/10.1038/nrg3606 [PubMed]
- 21. Brazão TF, Johnson JS, Müller J, Heger A, Ponting CP, Tybulewicz VL. Long noncoding RNAs in B-cell development and activation. Blood. 2016; 128:e10–19. https://doi.org/10.1182/blood-2015-11-680843 [PubMed]
- 22. Petri A, Dybkær K, Bøgsted M, Thrue CA, Hagedorn PH, Schmitz A, Bødker JS, Johnsen HE, Kauppinen S. Long noncoding RNA expression during human B-cell development. PLoS One. 2015; 10:e0138236. https://doi.org/10.1371/journal.pone.0138236 [PubMed]
- 23. Bhan A, Soleimani M, Mandal SS. Long noncoding RNA and cancer: a new paradigm. Cancer Res. 2017; 77:3965–81. https://doi.org/10.1158/0008-5472.CAN-16-2634 [PubMed]
- 24. Verma A, Jiang Y, Du W, Fairchild L, Melnick A, Elemento O. Transcriptome sequencing reveals thousands of novel long non-coding RNAs in B cell lymphoma. Genome Med. 2015; 7:110. https://doi.org/10.1186/s13073-015-0230-7 [PubMed]
- 25. Cheng H, Yan Z, Wang X, Cao J, Chen W, Qi K, Zhou D, Xia J, Qi N, Li Z, Xu K. Downregulation of long non-coding RNA TUG1 suppresses tumor growth by promoting ubiquitination of MET in diffuse large B-cell lymphoma. Mol Cell Biochem. 2019; 461:47–56. https://doi.org/10.1007/s11010-019-03588-7 [PubMed]
- 26. Wang QM, Lian GY, Song Y, Huang YF, Gong Y. LncRNA MALAT1 promotes tumorigenesis and immune escape of diffuse large B cell lymphoma by sponging miR-195. Life Sci. 2019; 231:116335. https://doi.org/10.1016/j.lfs.2019.03.040 [PubMed]
- 27. Deng L, Jiang L, Tseng KF, Liu Y, Zhang X, Dong R, Lu Z, Wang X. Aberrant NEAT1_1 expression may be a predictive marker of poor prognosis in diffuse large B cell lymphoma. Cancer Biomark. 2018; 23:157–64. https://doi.org/10.3233/CBM-160221 [PubMed]
- 28. Liu YR, Jiang YZ, Xu XE, Hu X, Yu KD, Shao ZM. Comprehensive Transcriptome Profiling Reveals Multigene Signatures in Triple-Negative Breast Cancer. Clin Cancer Res. 2016; 22:1653–62. https://doi.org/10.1158/1078-0432.CCR-15-1555 [PubMed]
- 29. Dai W, Feng Y, Mo S, Xiang W, Li Q, Wang R, Xu Y, Cai G. Transcriptome profiling reveals an integrated mRNA-lncRNA signature with predictive value of early relapse in colon cancer. Carcinogenesis. 2018; 39:1235–44. https://doi.org/10.1093/carcin/bgy087 [PubMed]
- 30. Sun J, Cheng L, Shi H, Zhang Z, Zhao H, Wang Z, Zhou M. A potential panel of six-long non-coding RNA signature to improve survival prediction of diffuse large-B-cell lymphoma. Sci Rep. 2016; 6:27842. https://doi.org/10.1038/srep27842 [PubMed]
- 31. Royston P, Altman DG. External validation of a Cox prognostic model: principles and methods. BMC Med Res Methodol. 2013; 13:33. https://doi.org/10.1186/1471-2288-13-33 [PubMed]
- 32. Steyerberg EW, Vickers AJ, Cook NR, Gerds T, Gonen M, Obuchowski N, Pencina MJ, Kattan MW. Assessing the performance of prediction models: a framework for traditional and novel measures. Epidemiology. 2010; 21:128–38. https://doi.org/10.1097/EDE.0b013e3181c30fb2 [PubMed]
- 33. Alba AC, Agoritsas T, Walsh M, Hanna S, Iorio A, Devereaux PJ, McGinn T, Guyatt G. Discrimination and calibration of clinical prediction models: users’ guides to the medical literature. JAMA. 2017; 318:1377–84. https://doi.org/10.1001/jama.2017.12126 [PubMed]
- 34. Pencina MJ, D’Agostino RB
Sr , Steyerberg EW. Extensions of net reclassification improvement calculations to measure usefulness of new biomarkers. Stat Med. 2011; 30:11–21. https://doi.org/10.1002/sim.4085 [PubMed] - 35. Collins GS, Reitsma JB, Altman DG, Moons KG. Transparent reporting of a multivariable prediction model for individual prognosis or diagnosis (TRIPOD): the TRIPOD statement. BMJ. 2015; 350:g7594. https://doi.org/10.1136/bmj.g7594 [PubMed]
- 36. Debray TP, Vergouwe Y, Koffijberg H, Nieboer D, Steyerberg EW, Moons KG. A new framework to enhance the interpretation of external validation studies of clinical prediction models. J Clin Epidemiol. 2015; 68:279–89. https://doi.org/10.1016/j.jclinepi.2014.06.018 [PubMed]
- 37. Holness MJ, Sugden MC. Regulation of pyruvate dehydrogenase complex activity by reversible phosphorylation. Biochem Soc Trans. 2003; 31:1143–51. https://doi.org/10.1042/bst0311143 [PubMed]
- 38. McFate T, Mohyeldin A, Lu H, Thakar J, Henriques J, Halim ND, Wu H, Schell MJ, Tsang TM, Teahan O, Zhou S, Califano JA, Jeoung NH, et al. Pyruvate dehydrogenase complex activity controls metabolic and malignant phenotype in cancer cells. J Biol Chem. 2008; 283:22700–8. https://doi.org/10.1074/jbc.M801765200 [PubMed]
- 39. Liu T, Yin H. PDK1 promotes tumor cell proliferation and migration by enhancing the Warburg effect in non-small cell lung cancer. Oncol Rep. 2017; 37:193–200. https://doi.org/10.3892/or.2016.5253 [PubMed]
- 40. Xiang G, Li X, Cao L, Zhu C, Dai Z, Pan S, Lin S. Frequent overexpression of PDK1 in primary nasopharyngeal carcinoma is associated with poor prognosis. Pathol Res Pract. 2016; 212:1102–07. https://doi.org/10.1016/j.prp.2016.10.006 [PubMed]
- 41. Wigfield SM, Winter SC, Giatromanolaki A, Taylor J, Koukourakis ML, Harris AL. PDK-1 regulates lactate production in hypoxia and is associated with poor prognosis in head and neck squamous cancer. Br J Cancer. 2008; 98:1975–84. https://doi.org/10.1038/sj.bjc.6604356 [PubMed]
- 42. Yoon S, Kim JG, Seo AN, Park SY, Kim HJ, Park JS, Choi GS, Jeong JY, Jun DY, Yoon GS, Kang BW. Clinical implication of serine metabolism-associated enzymes in colon cancer. Oncology. 2015; 89:351–59. https://doi.org/10.1159/000439571 [PubMed]
- 43. Kapp LD, Lorsch JR. The molecular mechanics of eukaryotic translation. Annu Rev Biochem. 2004; 73:657–704. https://doi.org/10.1146/annurev.biochem.73.030403.080419 [PubMed]
- 44. Cristiano L, Scaggiante B, Dapas B, Grassi G. The Role of the eEF1A Family in Human Cancers. 2008: pp. 177–193.
- 45. Scaggiante B, Dapas B, Grassi G, Manzini G. Interaction of G-rich GT oligonucleotides with nuclear-associated eEF1A is correlated with their antiproliferative effect in haematopoietic human cancer cell lines. FEBS J. 2006; 273:1350–61. https://doi.org/10.1111/j.1742-4658.2006.05143.x [PubMed]
- 46. Baschant U, Tuckermann J. The role of the glucocorticoid receptor in inflammation and immunity. J Steroid Biochem Mol Biol. 2010; 120:69–75. https://doi.org/10.1016/j.jsbmb.2010.03.058 [PubMed]
- 47. Nesset KA, Perri AM, Mueller CR. Frequent promoter hypermethylation and expression reduction of the glucocorticoid receptor gene in breast tumors. Epigenetics. 2014; 9:851–59. https://doi.org/10.4161/epi.28484 [PubMed]
- 48. Lind GE, Kleivi K, Meling GI, Teixeira MR, Thiis-Evensen E, Rognum TO, Lothe RA. ADAMTS1, CRABP1, and NR3C1 identified as epigenetically deregulated genes in colorectal tumorigenesis. Cell Oncol. 2006; 28:259–72. [PubMed]
- 49. Pan D, Kocherginsky M, Conzen SD. Activation of the glucocorticoid receptor is associated with poor prognosis in estrogen receptor-negative breast cancer. Cancer Res. 2011; 71:6360–70. https://doi.org/10.1158/0008-5472.CAN-11-0362 [PubMed]
- 50. Veneris JT, Huang L, Churpek JE, Conzen SD, Fleming GF. Glucocorticoid receptor expression is associated with inferior overall survival independent of BRCA mutation status in ovarian cancer. Int J Gynecol Cancer. 2019; 29:357–64. https://doi.org/10.1136/ijgc-2018-000101 [PubMed]
- 51. Gaynon PS, Carrel AL. Glucocorticosteroid therapy in childhood acute lymphoblastic leukemia. Adv Exp Med Biol. 1999; 457:593–605. https://doi.org/10.1007/978-1-4615-4811-9_66 [PubMed]
- 52. Li Y, Wang X, Zhang X, Goodrich DW. Human hHpr1/p84/Thoc1 regulates transcriptional elongation and physically links RNA polymerase II and RNA processing factors. Mol Cell Biol. 2005; 25:4023–33. https://doi.org/10.1128/MCB.25.10.4023-4033.2005 [PubMed]
- 53. Liu C, Yue B, Yuan C, Zhao S, Fang C, Yu Y, Yan D. Elevated expression of Thoc1 is associated with aggressive phenotype and poor prognosis in colorectal cancer. Biochem Biophys Res Commun. 2015; 468:53–58. https://doi.org/10.1016/j.bbrc.2015.10.166 [PubMed]
- 54. Li Y, Lin AW, Zhang X, Wang Y, Wang X, Goodrich DW. Cancer cells and normal cells differ in their requirements for Thoc1. Cancer Res. 2007; 67:6657–64. https://doi.org/10.1158/0008-5472.CAN-06-3234 [PubMed]
- 55. Chinnam M, Wang Y, Zhang X, Gold DL, Khoury T, Nikitin AY, Foster BA, Li Y, Bshara W, Morrison CD, Payne Ondracek RD, Mohler JL, Goodrich DW. The Thoc1 ribonucleoprotein and prostate cancer progression. J Natl Cancer Inst. 2014; 106:dju306. https://doi.org/10.1093/jnci/dju306 [PubMed]
- 56. Han J, Lv P, Yu JL, Wu YC, Zhu X, Hong LL, Zhu WY, Yu QM, Wang XB, Li P, Ling ZQ. Circulating methylated MINT2 promoter DNA is a potential poor prognostic factor in gastric cancer. Dig Dis Sci. 2014; 59:1160–68. https://doi.org/10.1007/s10620-013-3007-0 [PubMed]
- 57. Chang SJ, Wang TY, Tsai CY, Hu TF, Chang MD, Wang HW. Increased epithelial stem cell traits in advanced endometrial endometrioid carcinoma. BMC Genomics. 2009; 10:613. https://doi.org/10.1186/1471-2164-10-613 [PubMed]
- 58. An C, Choi IS, Yao JC, Worah S, Xie K, Mansfield PF, Ajani JA, Rashid A, Hamilton SR, Wu TT. Prognostic significance of CpG island methylator phenotype and microsatellite instability in gastric carcinoma. Clin Cancer Res. 2005; 11:656–63. https://clincancerres.aacrjournals.org/content/11/2/656 [PubMed]
- 59. Zhao X, Cai H, Wang X, Ma L. Discovery of signature genes in gastric cancer associated with prognosis. Neoplasma. 2016; 63:239–45. https://doi.org/10.4149/209_150531N303 [PubMed]
- 60. Han W, Du X, Liu M, Wang J, Sun L, Li Y. Increased expression of long non-coding RNA SNHG16 correlates with tumor progression and poor prognosis in non-small cell lung cancer. Int J Biol Macromol. 2019; 121:270–78. https://doi.org/10.1016/j.ijbiomac.2018.10.004 [PubMed]
- 61. Li S, Zhang S, Chen J. C-myc induced upregulation of long non-coding RNA SNHG16 enhances progression and carcinogenesis in oral squamous cell carcinoma. Cancer Gene Ther. 2019; 26:400–10. https://doi.org/10.1038/s41417-018-0072-8 [PubMed]
- 62. Visco C, Li Y, Xu-Monette ZY, Miranda RN, Green TM, Li Y, Tzankov A, Wen W, Liu WM, Kahl BS, d’Amore ES, Montes-Moreno S, Dybkær K, et al. Comprehensive gene expression profiling and immunohistochemical studies support application of immunophenotypic algorithm for molecular subtype classification in diffuse large B-cell lymphoma: a report from the international DLBCL rituximab-CHOP consortium program study. Leukemia. 2012; 26:2103–13. https://doi.org/10.1038/leu.2012.83 [PubMed]
- 63. Shaknovich R, Geng H, Johnson NA, Tsikitas L, Cerchietti L, Greally JM, Gascoyne RD, Elemento O, Melnick A. DNA methylation signatures define molecular subtypes of diffuse large B-cell lymphoma. Blood. 2010; 116:e81–89. https://doi.org/10.1182/blood-2010-05-285320 [PubMed]
- 64. Dubois S, Tesson B, Mareschal S, Viailly PJ, Bohers E, Ruminy P, Etancelin P, Peyrouze P, Copie-Bergman C, Fabiani B, Petrella T, Jais JP, Haioun C, et al, and Lymphoma Study Association (LYSA) investigators. Refining diffuse large B-cell lymphoma subgroups using integrated analysis of molecular profiles. EBioMedicine. 2019; 48:58–69. https://doi.org/10.1016/j.ebiom.2019.09.034 [PubMed]
- 65. Chapuy B, Stewart C, Dunford AJ, Kim J, Kamburov A, Redd RA, Lawrence MS, Roemer MG, Li AJ, Ziepert M, Staiger AM, Wala JA, Ducar MD, et al. Molecular subtypes of diffuse large B cell lymphoma are associated with distinct pathogenic mechanisms and outcomes. Nat Med. 2018; 24:679–90. https://doi.org/10.1038/s41591-018-0016-8 [PubMed]
- 66. Johnson WE, Li C, Rabinovic A. Adjusting batch effects in microarray expression data using empirical Bayes methods. Biostatistics. 2007; 8:118–27. https://doi.org/10.1093/biostatistics/kxj037 [PubMed]
- 67. Irizarry RA, Hobbs B, Collin F, Beazer-Barclay YD, Antonellis KJ, Scherf U, Speed TP. Exploration, normalization, and summaries of high density oligonucleotide array probe level data. Biostatistics. 2003; 4:249–64. https://doi.org/10.1093/biostatistics/4.2.249 [PubMed]
- 68. Zhang X, Sun S, Pu JK, Tsang AC, Lee D, Man VO, Lui WM, Wong ST, Leung GK. Long non-coding RNA expression profiles predict clinical phenotypes in glioma. Neurobiol Dis. 2012; 48:1–8. https://doi.org/10.1016/j.nbd.2012.06.004 [PubMed]
- 69. Peng F, Wang R, Zhang Y, Zhao Z, Zhou W, Chang Z, Liang H, Zhao W, Qi L, Guo Z, Gu Y. Differential expression analysis at the individual level reveals a lncRNA prognostic signature for lung adenocarcinoma. Mol Cancer. 2017; 16:98. https://doi.org/10.1186/s12943-017-0666-z [PubMed]
- 70. Stuart EA. Matching methods for causal inference: a review and a look forward. Stat Sci. 2010; 25:1–21. https://doi.org/10.1214/09-STS313 [PubMed]
- 71. Smyth GK. Linear models and empirical bayes methods for assessing differential expression in microarray experiments. Stat Appl Genet Mol Biol. 2004; 3:Article3. https://doi.org/10.2202/1544-6115.1027 [PubMed]
- 72. Ganz P, Heidecker B, Hveem K, Jonasson C, Kato S, Segal MR, Sterling DG, Williams SA. Development and validation of a protein-based risk score for cardiovascular outcomes among patients with stable coronary heart disease. JAMA. 2016; 315:2532–41. https://doi.org/10.1001/jama.2016.5951 [PubMed]
- 73. Balachandran VP, Gonen M, Smith JJ, DeMatteo RP. Nomograms in oncology: more than meets the eye. Lancet Oncol. 2015; 16:e173–80. https://doi.org/10.1016/S1470-2045(14)71116-7 [PubMed]
- 74. Heagerty PJ, Zheng Y. Survival model predictive accuracy and ROC curves. Biometrics. 2005; 61:92–105. https://doi.org/10.1111/j.0006-341X.2005.030814.x [PubMed]
- 75. Langfelder P, Horvath S. WGCNA: an R package for weighted correlation network analysis. BMC Bioinformatics. 2008; 9:559. https://doi.org/10.1186/1471-2105-9-559 [PubMed]
- 76. Yu G, Wang LG, Han Y, He QY. clusterProfiler: an R package for comparing biological themes among gene clusters. OMICS. 2012; 16:284–87. https://doi.org/10.1089/omi.2011.0118 [PubMed]