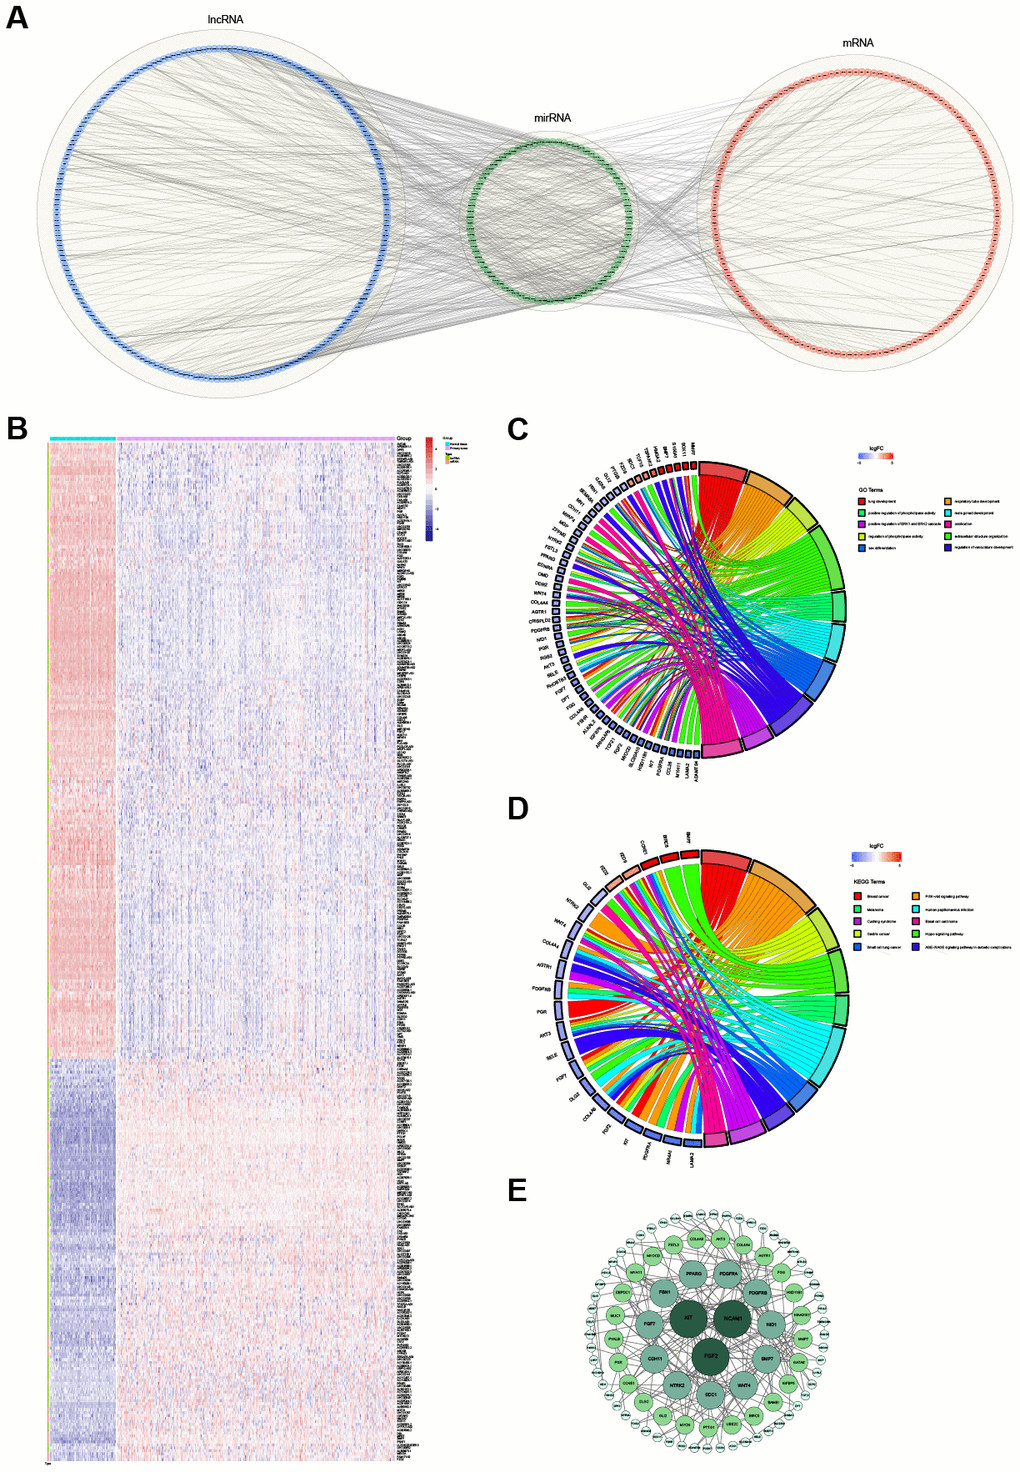
Figure 4.The ceRNA regulatory network and functional analysis. (A) The ceRNA network of lncRNA-miRNA-mRNA. The lncRNAs, miRNAs and mRNAs are indicated as blue, green and red, respectively. (B) The heatmap of the expression of 347 selected RNAs (201 lncRNAs and 146 mRNAs) in the ceRNA regulatory network. (C) The top 10 significantly enriched Gene Ontology (GO) biological process (BP) terms of mRNAs involved in the ceRNA regulatory network. (D) The top 10 significantly enriched Kyoto Encyclopedia of Genes and Genomes (KEGG) pathways of mRNAs involved in the ceRNA regulatory network. (E) The protein-protein interaction network. The greater the degree of the node, the bigger the node.