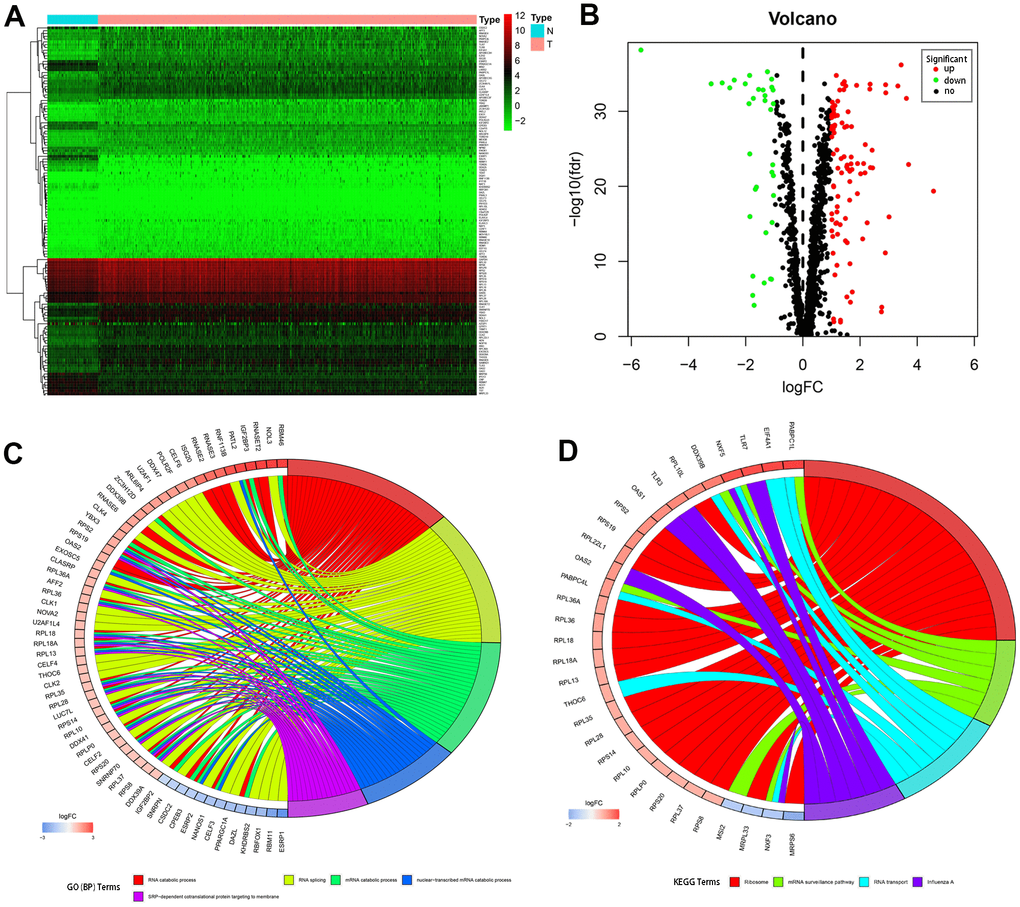
Figure 1.Differentially expressed RBPs in kidney renal clear cell carcinoma and functional enrichments. (A) Heatmaps of the differently expressed RBPs. Red and blue colors indicate higher and lower gene expression values, respectively. T indicates tumor tissues and N indicates non-tumor tissues. (B) Volcano plot of the differentially expressed RBPs. Red and blue colors indicate upregulated and downregulated RBPs, respectively. (C) Circos plot demonstrating relationships between selected GO-BP terms and associated RBPs. (D) Circos plot demonstrating relationships between selected KEGG terms and associated RBPs. Symbols for differentially expressed RBPs are shown on the left side of the graph. RBPs are ordered based on their logFC values. Relationships between RBPs and terms are indicated by colored connecting lines.