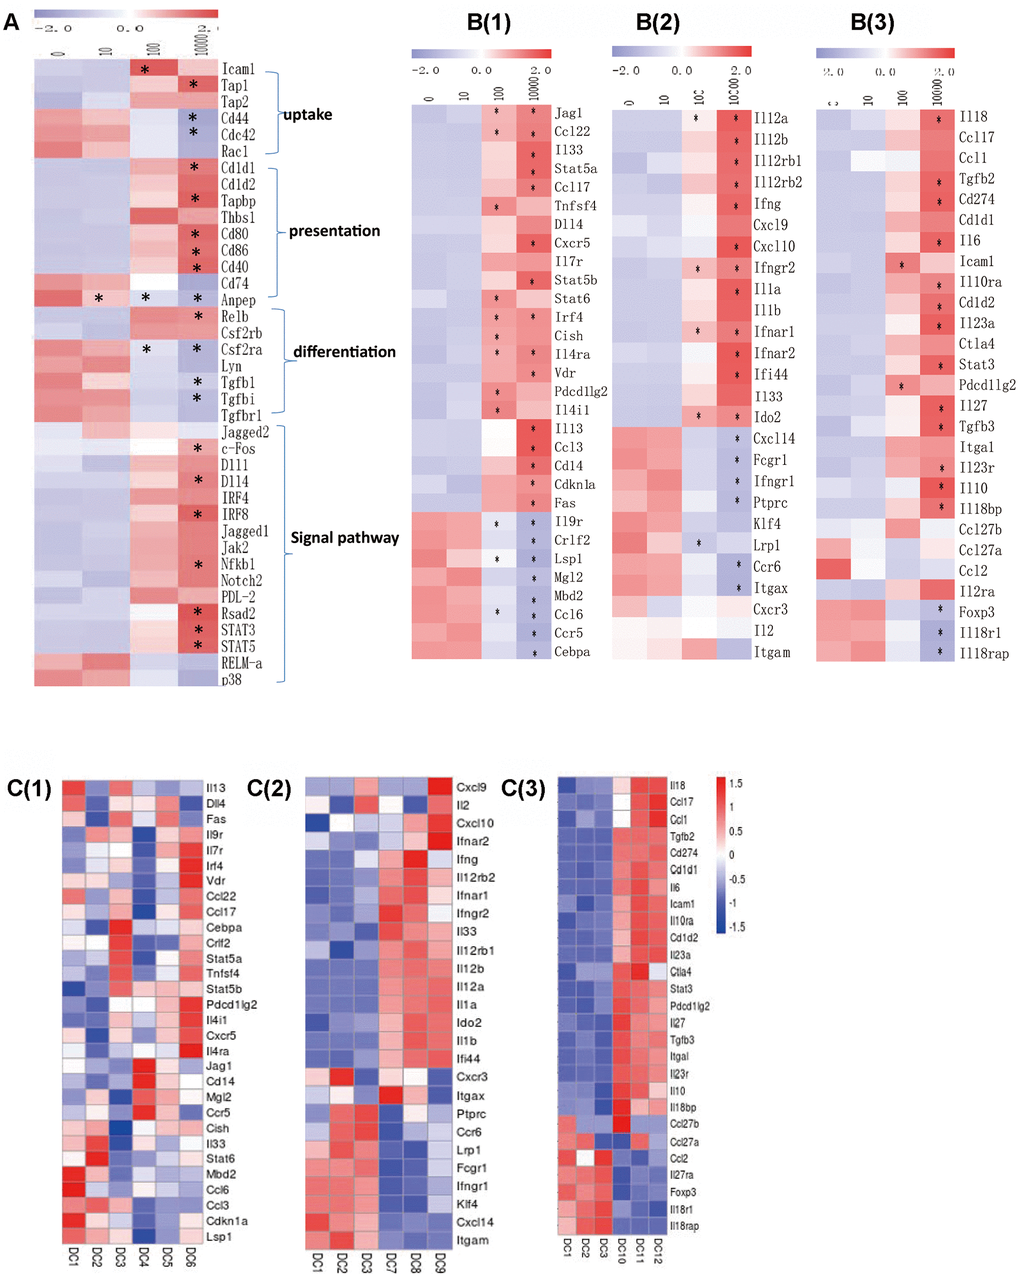
Figure 6.(A) The RPKM value of DC function genes in each dose group in each concentration group. B(1) The RPKM value of the gene induced Th2 cells differentiation in each concentration group. B(2) The RPKM value of the gene induced Th1 cells differentiation in each concentration group. B(3) The RPKM value of the gene induced Treg cells differentiation in each concentration group. C(1) The RPKM value of the gene induced Th2 cells differentiation in 10-0 group. C(2) The RPKM value of the gene induced Th1 cells differentiation in 100-0 group. C(3) The RPKM value of the gene induced Treg cells differentiation in 10000-0 group. DC1/2/3 represents 0ugml DC4/5/6 represents 10ug/ml. DC7/8/9 represents 100ug/ml DC10/11/12 represents 10000ug/ml. Data indicate the mean±SD *p<0.05 represents the differences between the treatment group and the control group. n = 3 independent experiments.