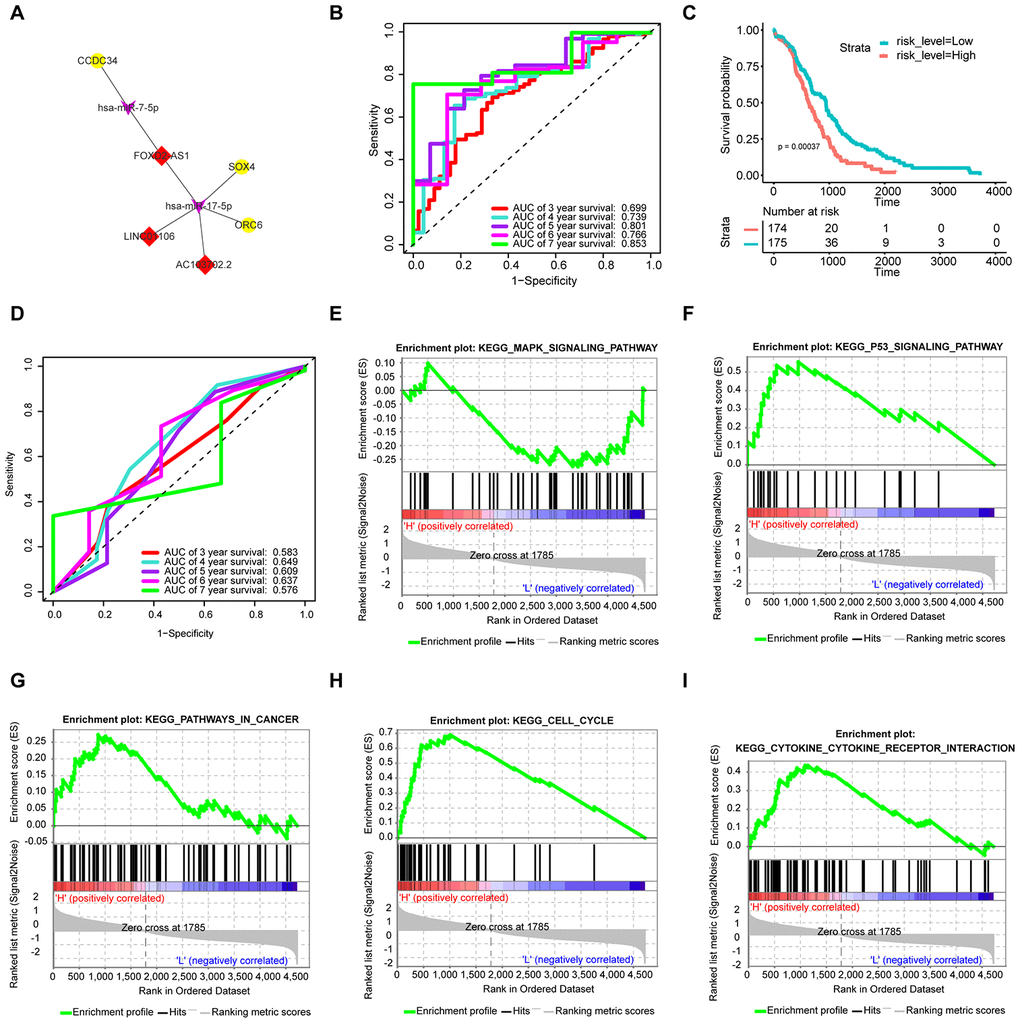
Figure 5.Construction of the prognostic signature based on the survival-specific ceRNA network and GSEA. (A) Hub ceRNA network. Notes: Red diamonds represent upregulated lncRNAs, purple arrows represent miRNAs, and gold circles represent upregulated mRNAs. (B) ROC curve analyses based on the signature. (C) KM curves of OS based on the signature. (D) ROC curve analyses based on the traditional TNM pathological staging system. (E–I) GSEA. Notes: H denotes a high signature score, while L denotes a low signature score.