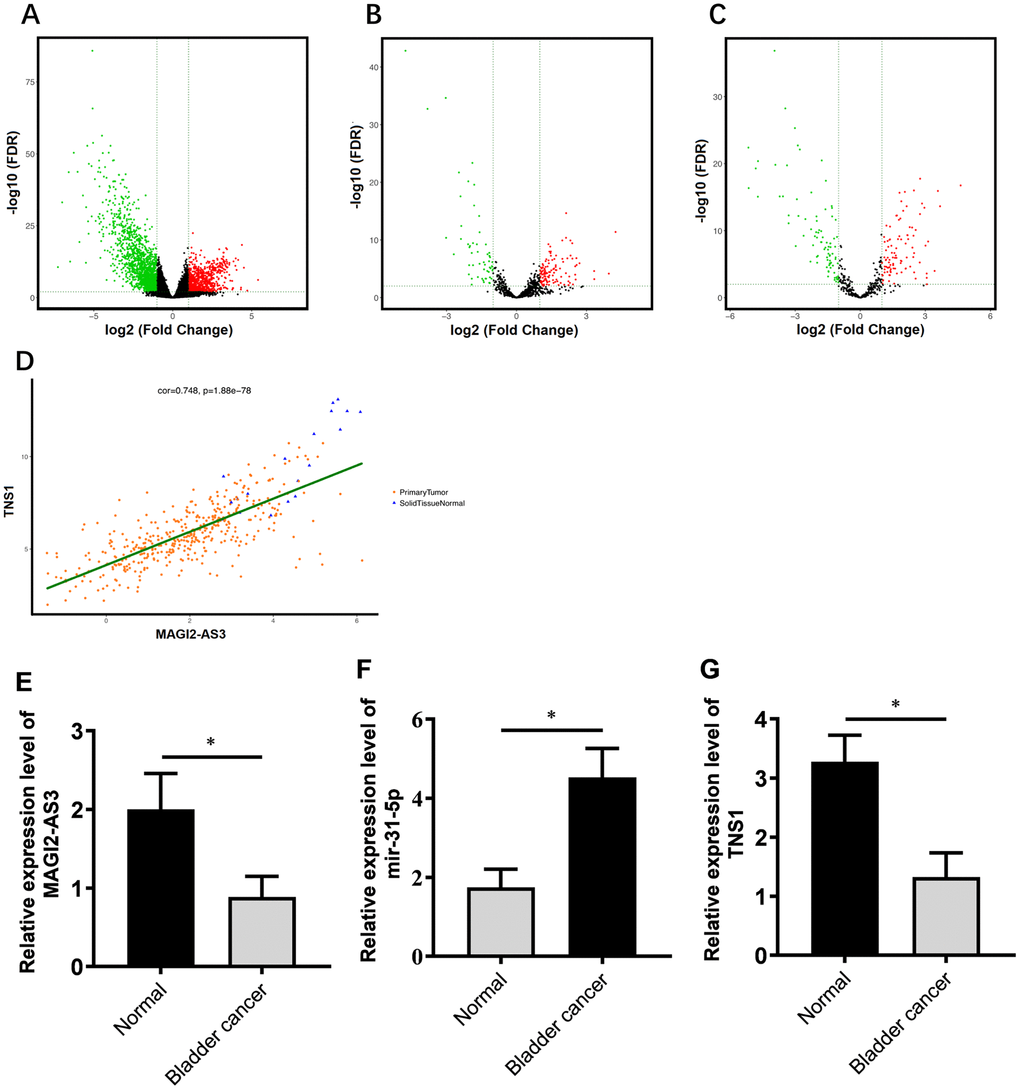
Figure 1.Correlation analysis of MAGI2-AS3, miR-31-5p and TNS1 mRNA expression in TGCA-BCa patient tissues. (A) Volcanic map of differentially expressed mRNAs in BCa tissues compared to normal urothelial tissues. (B) Volcanic map of differentially expressed lncRNAs in BCa tissues compared to normal urothelial tissues. (C) Volcanic map of differentially expressed miRNAs in BCa tissues compared to normal urothelial tissues. Note: p<0.05 and logFC>2 were used as threshold parameters. Green dots represent down-regulated RNAs, and red dots represent up-regulated RNAs. (D) Distribution map shows correlation between MAGI2-AS3 and TNS1 expression in BCa patients from the TGCA database. Orange dots represent primary BCa samples and blue triangles represent normal urothelial tissue samples. (E–G) Histogram plots show the expression of MAGI2-AS3, mir-31-5p and TNS1 in BCa and normal bladder tissues in the TCGA database. The analyses were performed using the R software. * denotes p<0.05 and **denotes p<0.01.