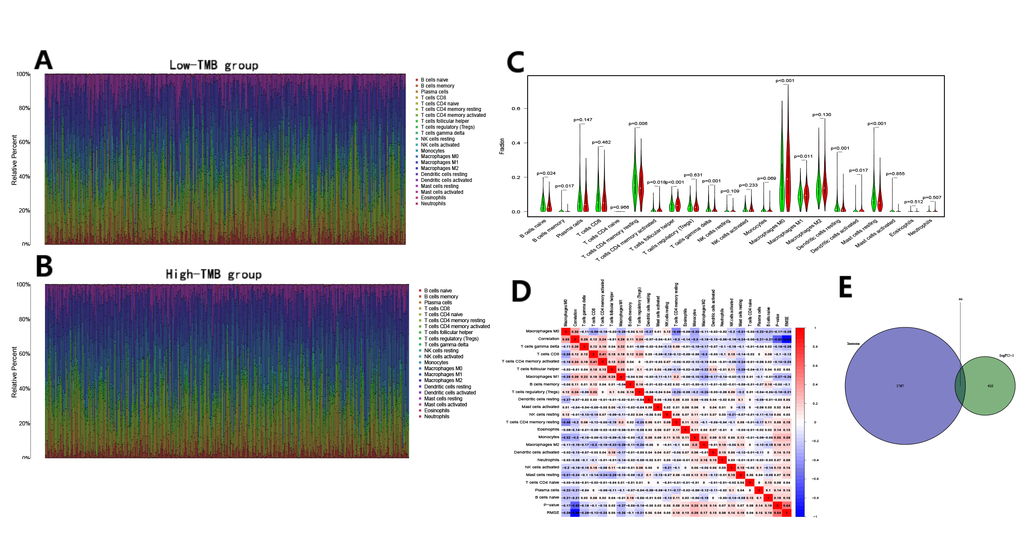
Figure 3.Immune cell content in the high and low TMB groups and the identification of TMB-related immune genes. (A, B) The stacked bar chart indicates the distribution of 22 immune cells in the low and high TMB groups, respectively; (C) The violin plot indicates the differentially infiltrated immune cells between in the high and low TMB groups. The green color represents the low TMB group, and the red color represents the high TMB group; (D) The correlation matrix of immune cell proportions. The red color represents positive correlations and the blue color represents negative correlations; (E) The identification of TMB-related immune genes.