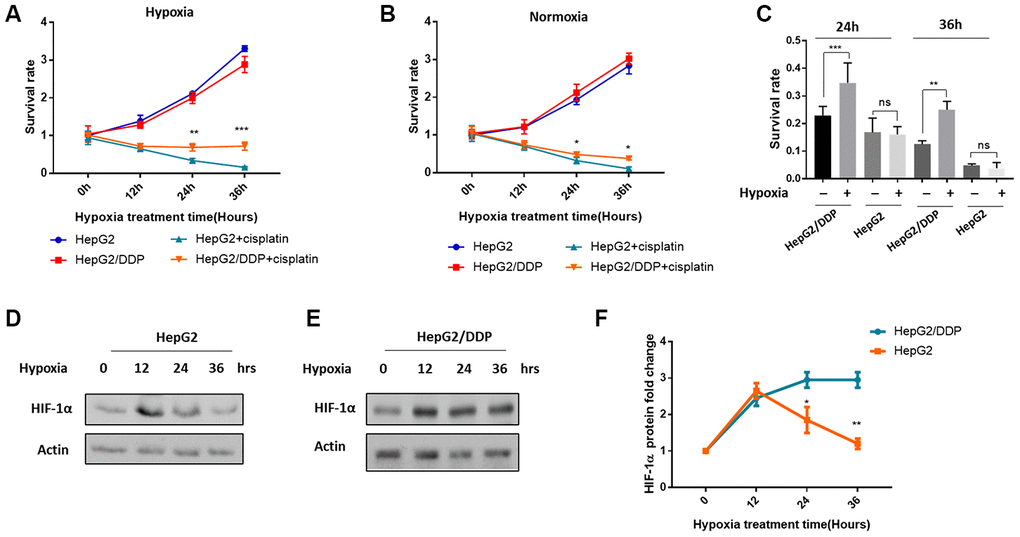
Figure 1.Differential HIF-1α induction and cisplatin resistance in HepG2/DDP versus HepG2 cells under mild hypoxia. (A) Cisplatin-mediated cytotoxicity in hepatocellular carcinoma cells under mild hypoxic condition (5% O2). The cisplatin-resistant (HepG2/DDP) and cisplatin-sensitive (HepG2) cells at 60% confluency were treated with or without 10 ug/ml cisplatin and incubated at mild hypoxic condition (5% O2). Cells were collected at indicated time points and analyzed by using CellTiter-Glo luminescence cell viability assay kit. Data from multiple independent experiments were normalized to the value at time 0. Student’s t-test was performed to evaluate the statistical significance. **P<0.001, ***P<0.0001. (B) Cisplatin-mediated toxicity in hepatocellular carcinoma cells under normoxia (21% O2). Experiments were performed as in (A) except that cells were incubated in the regular incubator with at 21% oxygen. Data were from multiple independent experiments and normalized to the value at time 0. Student’s t-test: *P<0.01. (C) Mild hypoxia (5% O2) induced cisplatin resistance in HepG2/DDP but not HepG2 cells. Data from both (A) and (B) after 24h and 36h of cisplatin treatment under normoxia or hypoxia were normalized to none-treated controls. Student’s t-test: ns, not significant, **P<0.001, ***P<0.0001. (D) Mild hypoxia (5% O2) transiently increased HIF-1α protein levels in HepG2 cells. HepG2 cells at 60% confluency were incubated at 5% O2 for indicated time point. HIF-1α protein levels were examined by Western blot using specific antibody against HIF-1α and Actin control. (E) Mild hypoxia (5% O2) caused sustained elevation of HIF-1α protein in HepG2/DDP cells. Experiments were performed as in (D) except HepG2/DDP cells were used. (F) Comparison of induction of HIF-1α under mild hypoxic condition (5% O2) in HepG2 and HepG2/DDP cells. Several repeats of Western blot in (D) and (E) were quantified and normalized to time 0. Student’s t-test: *P<0.01, **P<0.001.