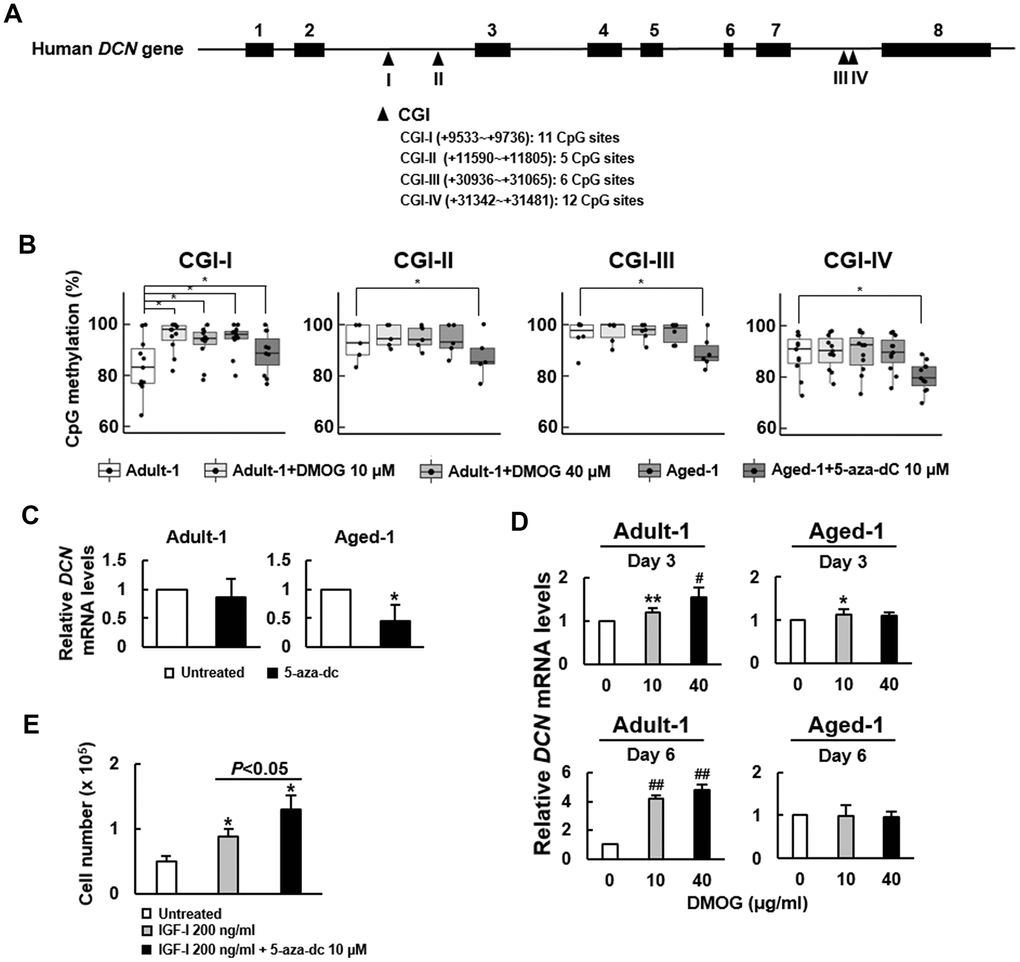
Figure 6.Effect of 5-aza-dC and DMOG on the methylation of CpG islands in DCN gene and the expression of DCN mRNA in Adult-1 and Aged-1 bmMSCs. (A) Schematic presentation of human DCN gene. Eight exons (■) and 4 predicted CpG islands (▲) in the introns are shown. CGI-I, -II, -III, and -IV contains 11, 5, 6, and 12 CpG sites, respectively. (B) Bisulfite sequencing. Adult-1 and Aged-1 cells were treated with DMOG (10 and 40 μM) and 5-aza-dC (10 μM) for 6 days, respectively. The methylation percentage of each CpG site of the 4 CGIs was determined. A one-way ANOVA plus Scheffe’s post hoc tests were used to analyze the differences among the treated Adult-1 and Aged-1 groups versus untreated Adult-1 cells. *, P<0.05 versus untreated Adult-1 cells. (C) RT-qPCR analyses. Adult-1 and Aged-1 cells were either left untreated or treated with 10 μM 5-aza-dC for 6 days. DCN mRNA levels of the treated cells were compared to those of the untreated. Data represent the mean ± S.D. from three experiments. *, P<0.01 versus untreated control by Student’s t-test. (D) RT-qPCR analyses. Adult-1 and Aged-1 cells were treated with 0, 10, and 40 μM DMOG for 3 and 6 days, and the DCN mRNA levels were measured. The normalized DCN signals in these cells were compared to that of the untreated cells (to which a value of 1 was assigned). Data represent the mean ± S.D. from three experiments. *, P<0.05; **, P<0.005; #, P<10-4; ##, P<10-6 versus untreated control by Student’s t-test. (E) Proliferation assay. Aged-1 cells were seeded into 12 10-cm cell culture dishes (1 x 10⁵ cells/dish) and were serum-starved for 16h. Then, 4 dishes of cells were left untreated, 4 dishes of cells were treated with 200 ng/ml IGF-I, and the other 4 dishes were treated with 200 ng/ml IGF-I plus 10 μM of 5-aza-dC. Cells were counted 6 days after. Data represent the mean ± SD. *, P<0.05 versus the untreated group. A one-way ANOVA plus Scheffe’s post hoc tests were used to analyze the differences among the groups. Student’s t-test was used to analyze the difference between the IGF-I-treated and the IGF-I plus 5-aza-dC-treated groups.