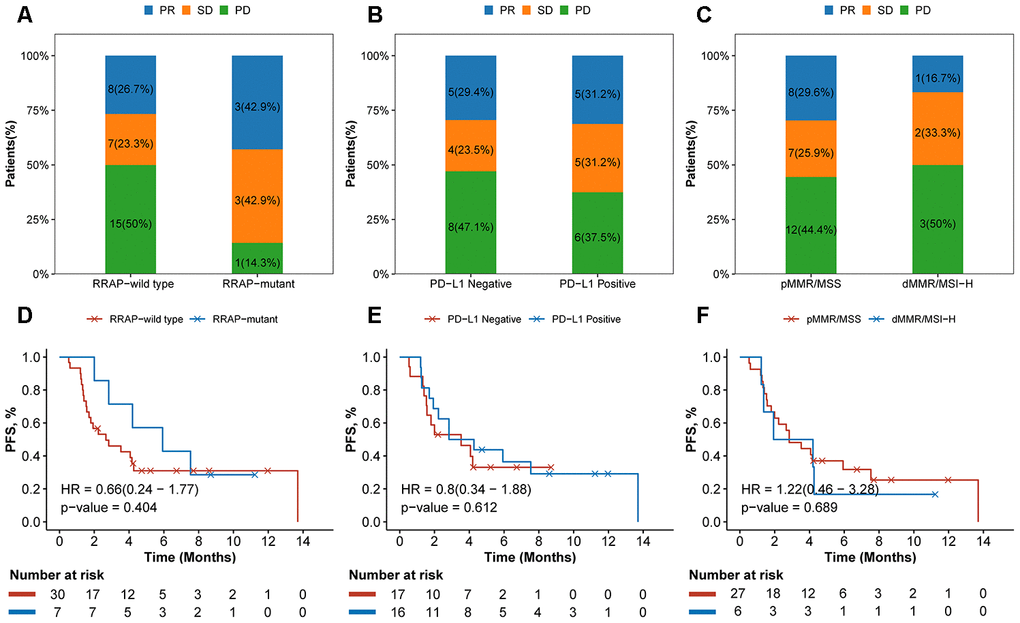
Figure 6.Association of RRAP and immunotherapy efficacy. (A–C) Stacked barplot showing the proportion of patients with progressive disease (PD), stable disease (SD), or partial response (PR) for each group divided by RRAP (A), PD-L1 (B) and MSI/MMR status (C). (D–F) The text indicates the number and percentage of patients in each group. Kaplan-Meier survival curves for patients grouped by RRAP (D), PD-L1 (E), and MSI/MMR status (F). P-values were estimated with the log-rank test, and HRs were estimated with the Cox model.