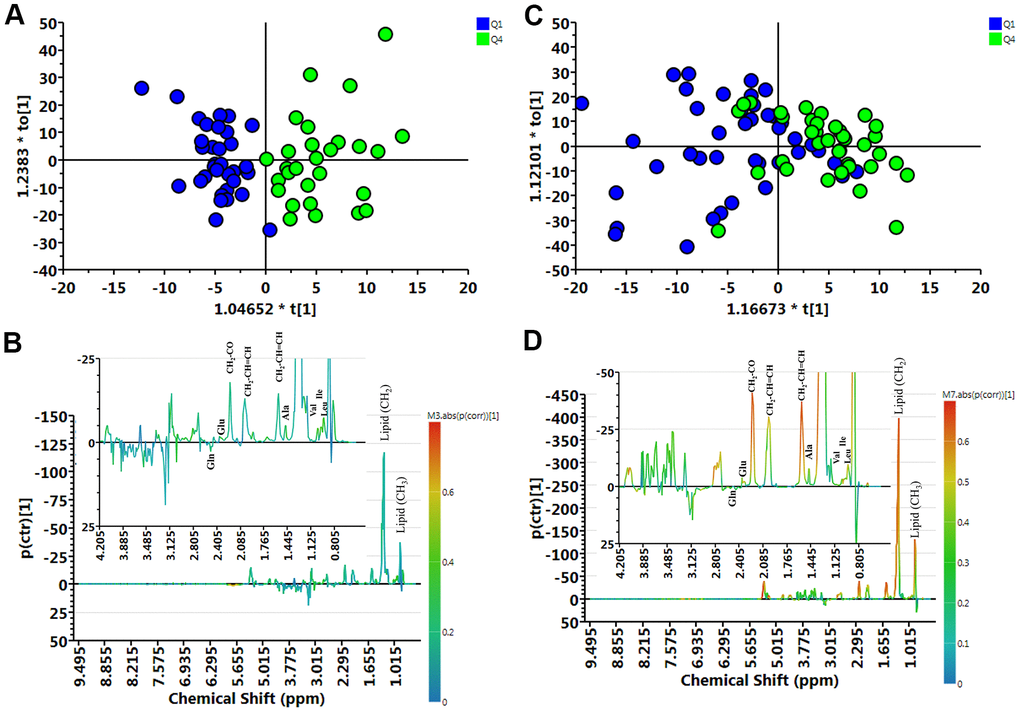
Figure 2.Muscle loss and control group samples analyzed by 1H NMR spectroscopy. (A) Orthogonal partial least-squares discriminant analysis plot (OPLS-DA) of the control (Q1) and muscle loss (Q4) subgroups in men showed considerable separation (R2X = 0.404, R2Y = 0.750, and Q2 = 0.316). (B) Contribution plots of control (Q1) and muscle loss (Q4). (C) OPLS-DA plot of control (Q1) and muscle loss (Q4) subgroups in women showed considerable separation (R2X = 0.362, R2Y = 0.360, and Q2 = 0.00307). (D) Contribution plots of control (Q1) and muscle loss (Q4). The results were revealing amino acid-related metabolites as important discriminators between Q1 and Q4.