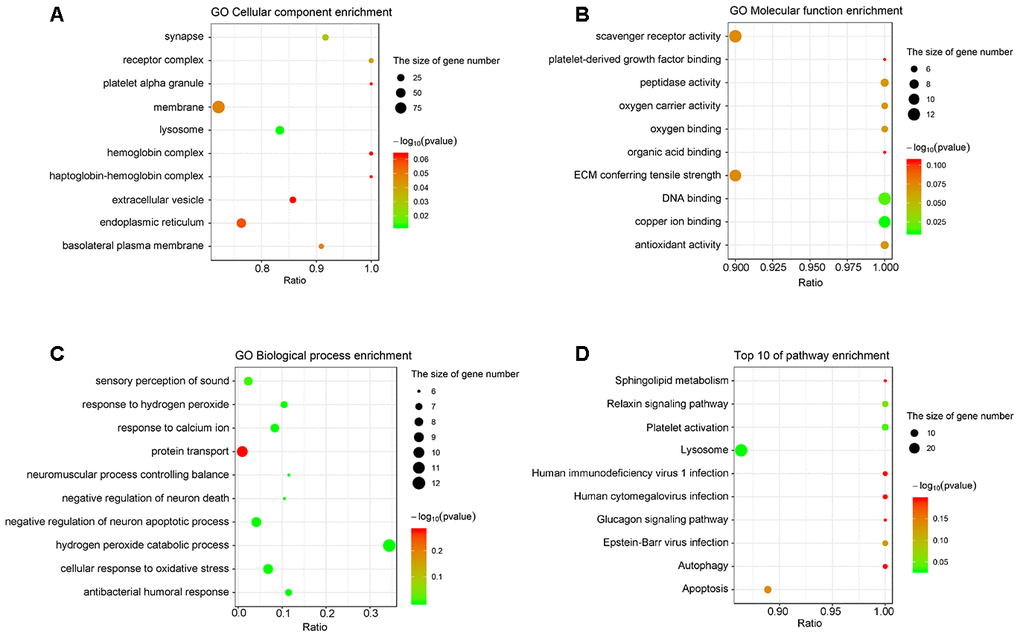
Figure 2.The analyses of GO enrichment and KEGG pathway. (A–C) The Go enrichment analysis revealed that the differentially expressed proteins were enriched in cellular component, molecular function, and biological process. (D) KEGG pathway analysis indicated the top 10 signaling pathways enriched by the differentially expressed proteins. The x-axis represents the ratio of candidate genes in the background gene. The y-axis represents the GO terms. The color of the bubble corresponds to the enrichment (-log10 (P value)), and the size of the bubble is proportional to the number of genes enriched in the pathway.